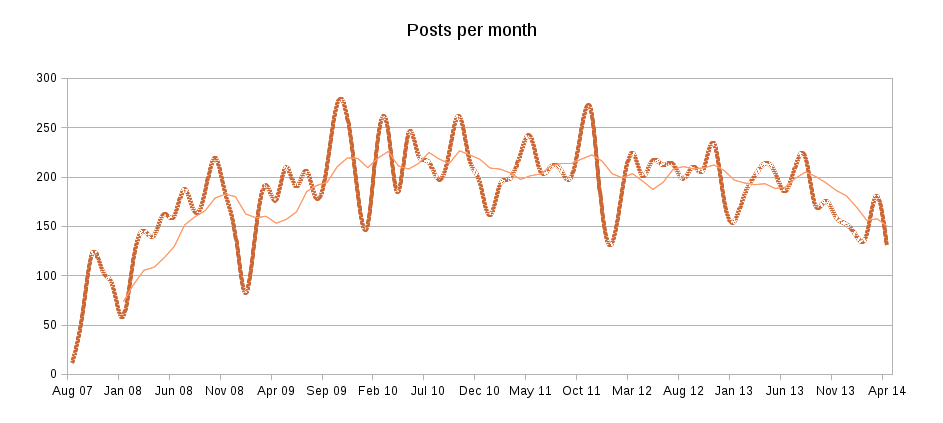
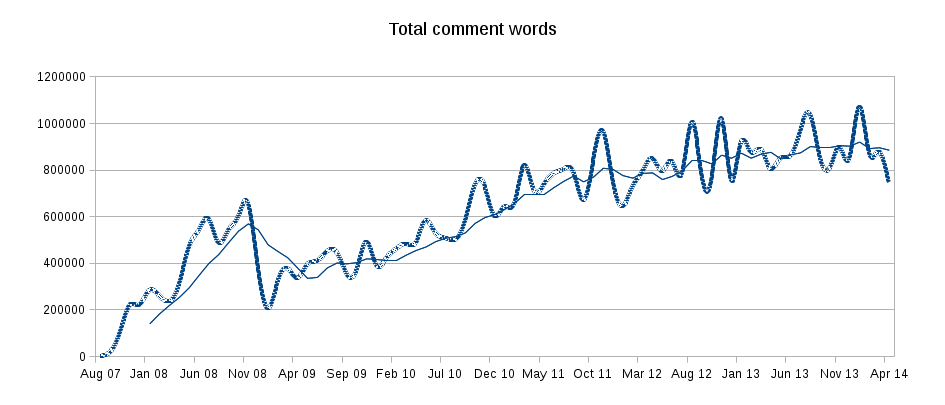
Over the this time period a number of authors who have run into conflicts between the time required for writing blog posts and either their work or family time over the last six months. Not to mention the inevitable exhaustion factors of running out of things to say. I’m actually surprised that we are still managing to put out quite so many posts (see chart below). We’re always looking for authors.
So if you have something to say, then email me at lprent [at] primary.geek.nz. I’m on a stay at home ‘holiday’ next week, so now would be a good time because I can pay more attention to them than when I have my head deep inside some code..
Of course having arrangements with a number of other blogging sites to repost their content into our often raucous maelstrom of commenting debate has helped a lot. If any other sites are interested in similar arrangements to get your posts viewed and commented on by a wider audience, then let me know. If there is one thing you can be sure of, it is that posts on this site will get comments and feedback.
Similarly, while I try to keep the RSS feed on the right up to date, but I’m always missing some. We primarily provide this to allow smaller sites on the left to get some read traffic to their sites. If you’re generally leftish then I’m happy to add you to it. Ideally when you point it out a site, then also give me a default squarish logo image for your site. The code collects the image that you have referenced on the post. But text posts will use the default logo.
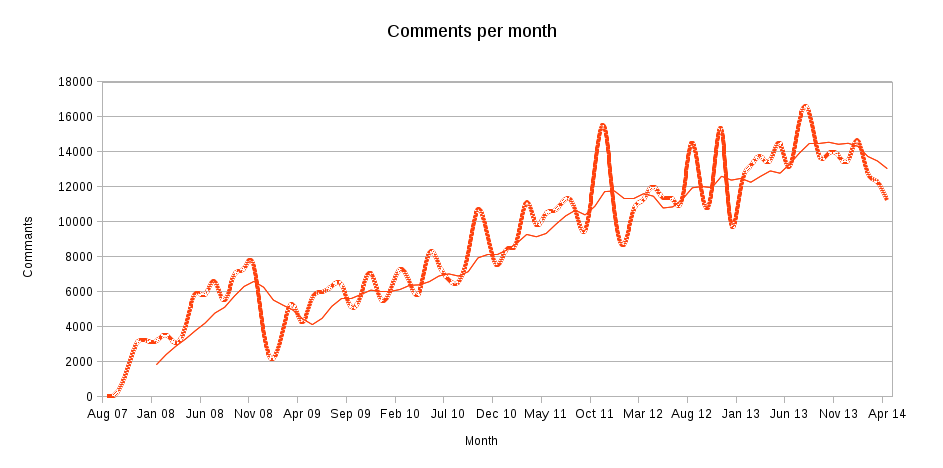
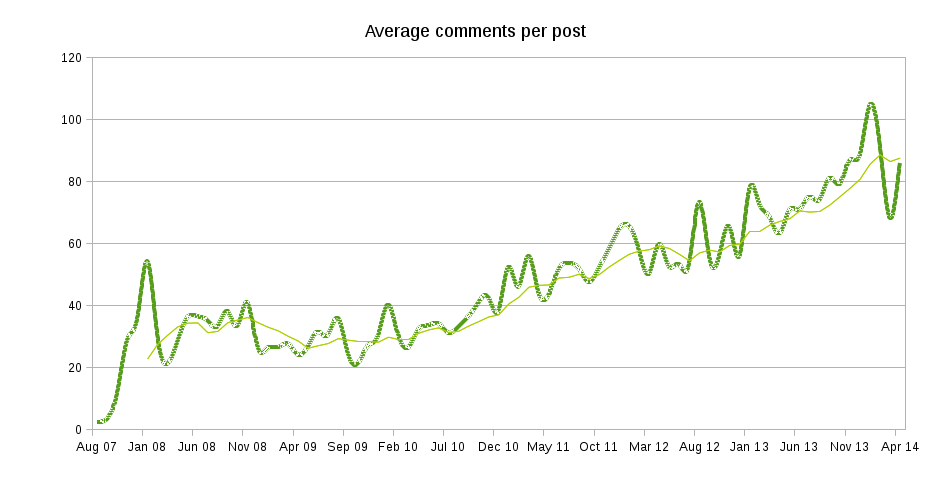
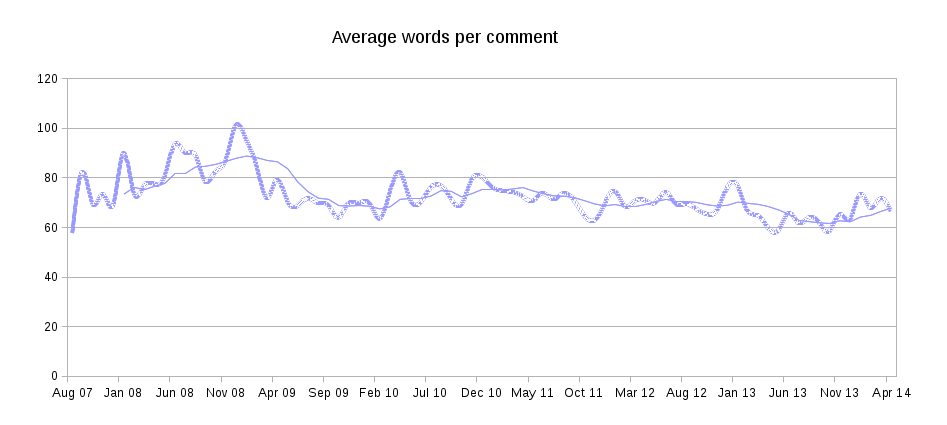
And a couple of other graphs..
Damn, that is writing a large book per month….
My limited time since October has been largely expended in making the mechanics of the site more sustainable when we hit the kinds of peak loadings that happen leading into the election. The last thing that we need is for the voices of the broad labour movement who write posts and comments on this site to fall into a overload black hole as it gets too popular.
This site is now pretty well dispersed into cloud servers with a whole lot of caching and autoscaling of resources. The controlling code literally automatically buys excess capacity when it needs it to fulfill demand, and drops it when the demand falls. It is pretty cool to watch.
There are still some tweaks that I have to put into place but essentially that task has been done.
Apart from working for a broad labour/left movement victory in the election, I suspect that my next six months will be expended on getting our finances that pay for those servers on a more sustainable basis.
Notes:
sum(length(comment_content)

- length(

replace(

replace(

replace(

replace(

replace(ltrim(rtrim(comment_content)), '\n', ' '),

' ', ' |'),

'| ', ''),

'|', ''),

' ', '')

) +1

) as words,
Powered by WPtouch Mobile Suite for WordPress