Well we have just moved out of the election month, and we’re now getting the gradual fall back of readership and posts heading to xmas. About the only growth around NZ at present is in political blogging.
I’m happy to say that we now appear to consistently be either level pegging with Kiwiblog or exceeding their totals for a number of months. Since we have been ‘advised’ many times that this would never happen, I’m finding that it is rather more satisfying than I expected.
The title of this post comes from a article in the Sunday Star Times early last month that gave an overview of the local blogosphere where it stated
There have been various attempts to rank the local blogs, although nothing definitive has been produced.
But what is not in dispute is the reign of Wellingtonian David Farrar as the nation’s blog king. His Kiwiblog site routinely tops the lists with something like 50,000 visits a week.
That is complete bullshit. There is long running ranking system. We’ve been trouncing Kiwiblog on everything from comments to page views for quite some time. But I guess Tony Fitzsimons doesn’t read around the blogs a lot or that he believes self-serving PR when it is dished up to him.
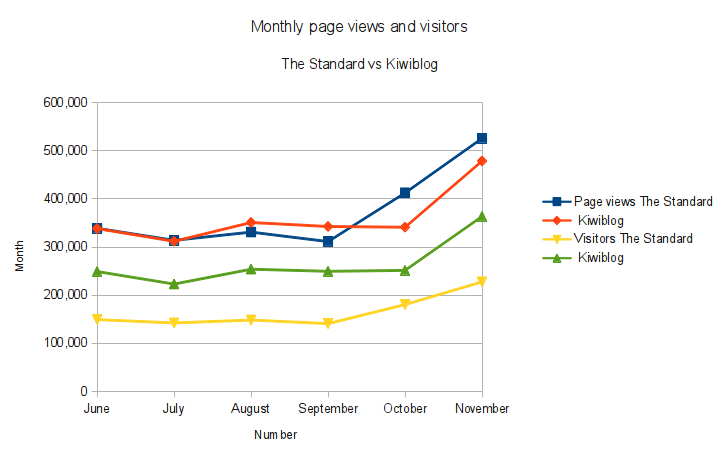
Open Parachute has been running a nice simple list using public information for quite a while. We finally went on it in May after I put in the required plugins and tested them. If you have a look at the Open Parachute numbers for November and earlier months (June to November1) collected from public StatCounter and SiteMeter data this is what you see for the consistent top two blogs2, on Open Parachutes blog rankings are Kiwiblog and The Standard. The Standard has been getting very similar or larger page views for quite some time.
| Month | Page views | Visitors | Pages per visit | |||
| The Standard | Kiwiblog | The Standard | Kiwiblog | The Standard | Kiwiblog | |
| June | 338,868 | 338,316 | 149,365 | 249,166 | 2.27 | 1.36 |
| July | 313,987 | 311,878 | 142,388 | 223,132 | 2.21 | 1.40 |
| August | 331,035 | 350,971 | 148,413 | 253,945 | 2.23 | 1.38 |
| September | 311,382 | 342,643 | 140,948 | 249,600 | 2.21 | 1.37 |
| October | 412,418 | 341,158 | 180,538 | 251,558 | 2.28 | 1.36 |
| November | 525,733 | 478,741 | 227,718 | 363,651 | 2.31 | 1.32 |
Now there are higher ‘visitors’ for Kiwiblog than for ourselves. But as Sitemeter states:-
Page Views are usually the safest item tracked that you can compare between different tracking systems. When you are browsing a site, every time you follow a link, it is treated as a single “page view”.
The main differences in the visitors appears to be from the different definitions of what is a ‘visit’.
The definition of a visit (or visitor) on one system, may not necessarily be the same thing as on another system. Site Meter’s definition is “a series of page views by one person with no more than 30 minutes in between page views”. 30 minutes is the “session” length timeout. The “session” length timeout is the amount of time that Site Meter waits for another page view from a visitors before it assumes they’ve left the site. Other systems may have a longer or shorter session periods.
I’d say so. We run Statcounter, Google Analytics, something for Neilson, Wassup, WordPress Stats and Awstats. When you look at visits using what look like the same criteria in October4 we have had between 130k visits to 220k visits depending on the package. When I was testing Sitemeter and Statcounter side by side in April with the same intervals I was getting significiant differences with Sitemeter being a bit higher during the week of testing.
Open Parachute picks up Statcounter from us. It is set to use an idle time of 6 hours on a cookie. Kiwiblog uses SiteMeter which is set to 30 minutes. Different packages. Different visitor numbers. Plus of course we have a different layout which influences it as well.
But page views are far more consistent. The total of the page views on the front page, post, and pages are usually within 5k on our site between the different stats packages over the period of a month. That is well within the margins of error for what is recognized as being a human read of a page
Because of the vagaries of dead Roman Emporers (damn you Julius Caesar) there are different days in different months so a clearer comparision is on a average daily basis.
| Month | Days | Weekends | Pages per day | Visits per day | ||
| The Standard | Kiwiblog | The Standard | Kiwiblog | |||
| June | 30 | 5 | 11,296 | 11,277 | 4,979 | 8,306 |
| July | 31 | 5 | 10,129 | 10,061 | 4,593 | 7,198 |
| August | 31 | 4 | 10,679 | 11,322 | 4,788 | 8,192 |
| September | 30 | 4 | 10,379 | 11,421 | 4,698 | 8,320 |
| October | 31 | 5 | 13,304 | 11,005 | 5,824 | 8,115 |
| November | 30 | 4 | 17,524 | 15,958 | 7,591 | 12,122 |
What was interesting was a post David Farrar made last week looking at his stats for election week to Saturday.
From Google Analytics.
- 38,110 unique visitors
- 105,531 visits – of which 10,000 are to the mobile version
- 213,626 page views
That means that nearly half of his page views for the month came in one week. Talk about people suddenly waking up to an election being on. But more on that in a later post.
I’ll have a look at other site measurements in later posts. But it is nice to be pushing ahead of Kiwiblog. I’m sure that the authors will be chuffed.
1. May was a problem for our stats. We had a spike when Facebook had a problem with their new async ‘like’ system and they started pounding our site for page views. It took a while to find a counter in .htaccess as they kept moving it. Eventually they fixed the problem. May was also the first month that we were on Open Parachute.
2. Open Parachute isn’t complete by any stretch of the imagination. There are a number of sites that don’t have public stats, where the stats are not public, or where people haven’t told Ken where to read the stats. There are a couple of sites that sometimes pop up to the top of his stats for a month. However they are sites that largely have a readership that appears to largely be outside New Zealand.
3. Note that these are not ‘hits’ as you’d get off a logs package like AwStats and they exclude pages requested from all identified spambots and spiders.
4. When I was looking at this post, I picked up some of the stats before the end of the month. That is why these figures are for October
Powered by WPtouch Mobile Suite for WordPress