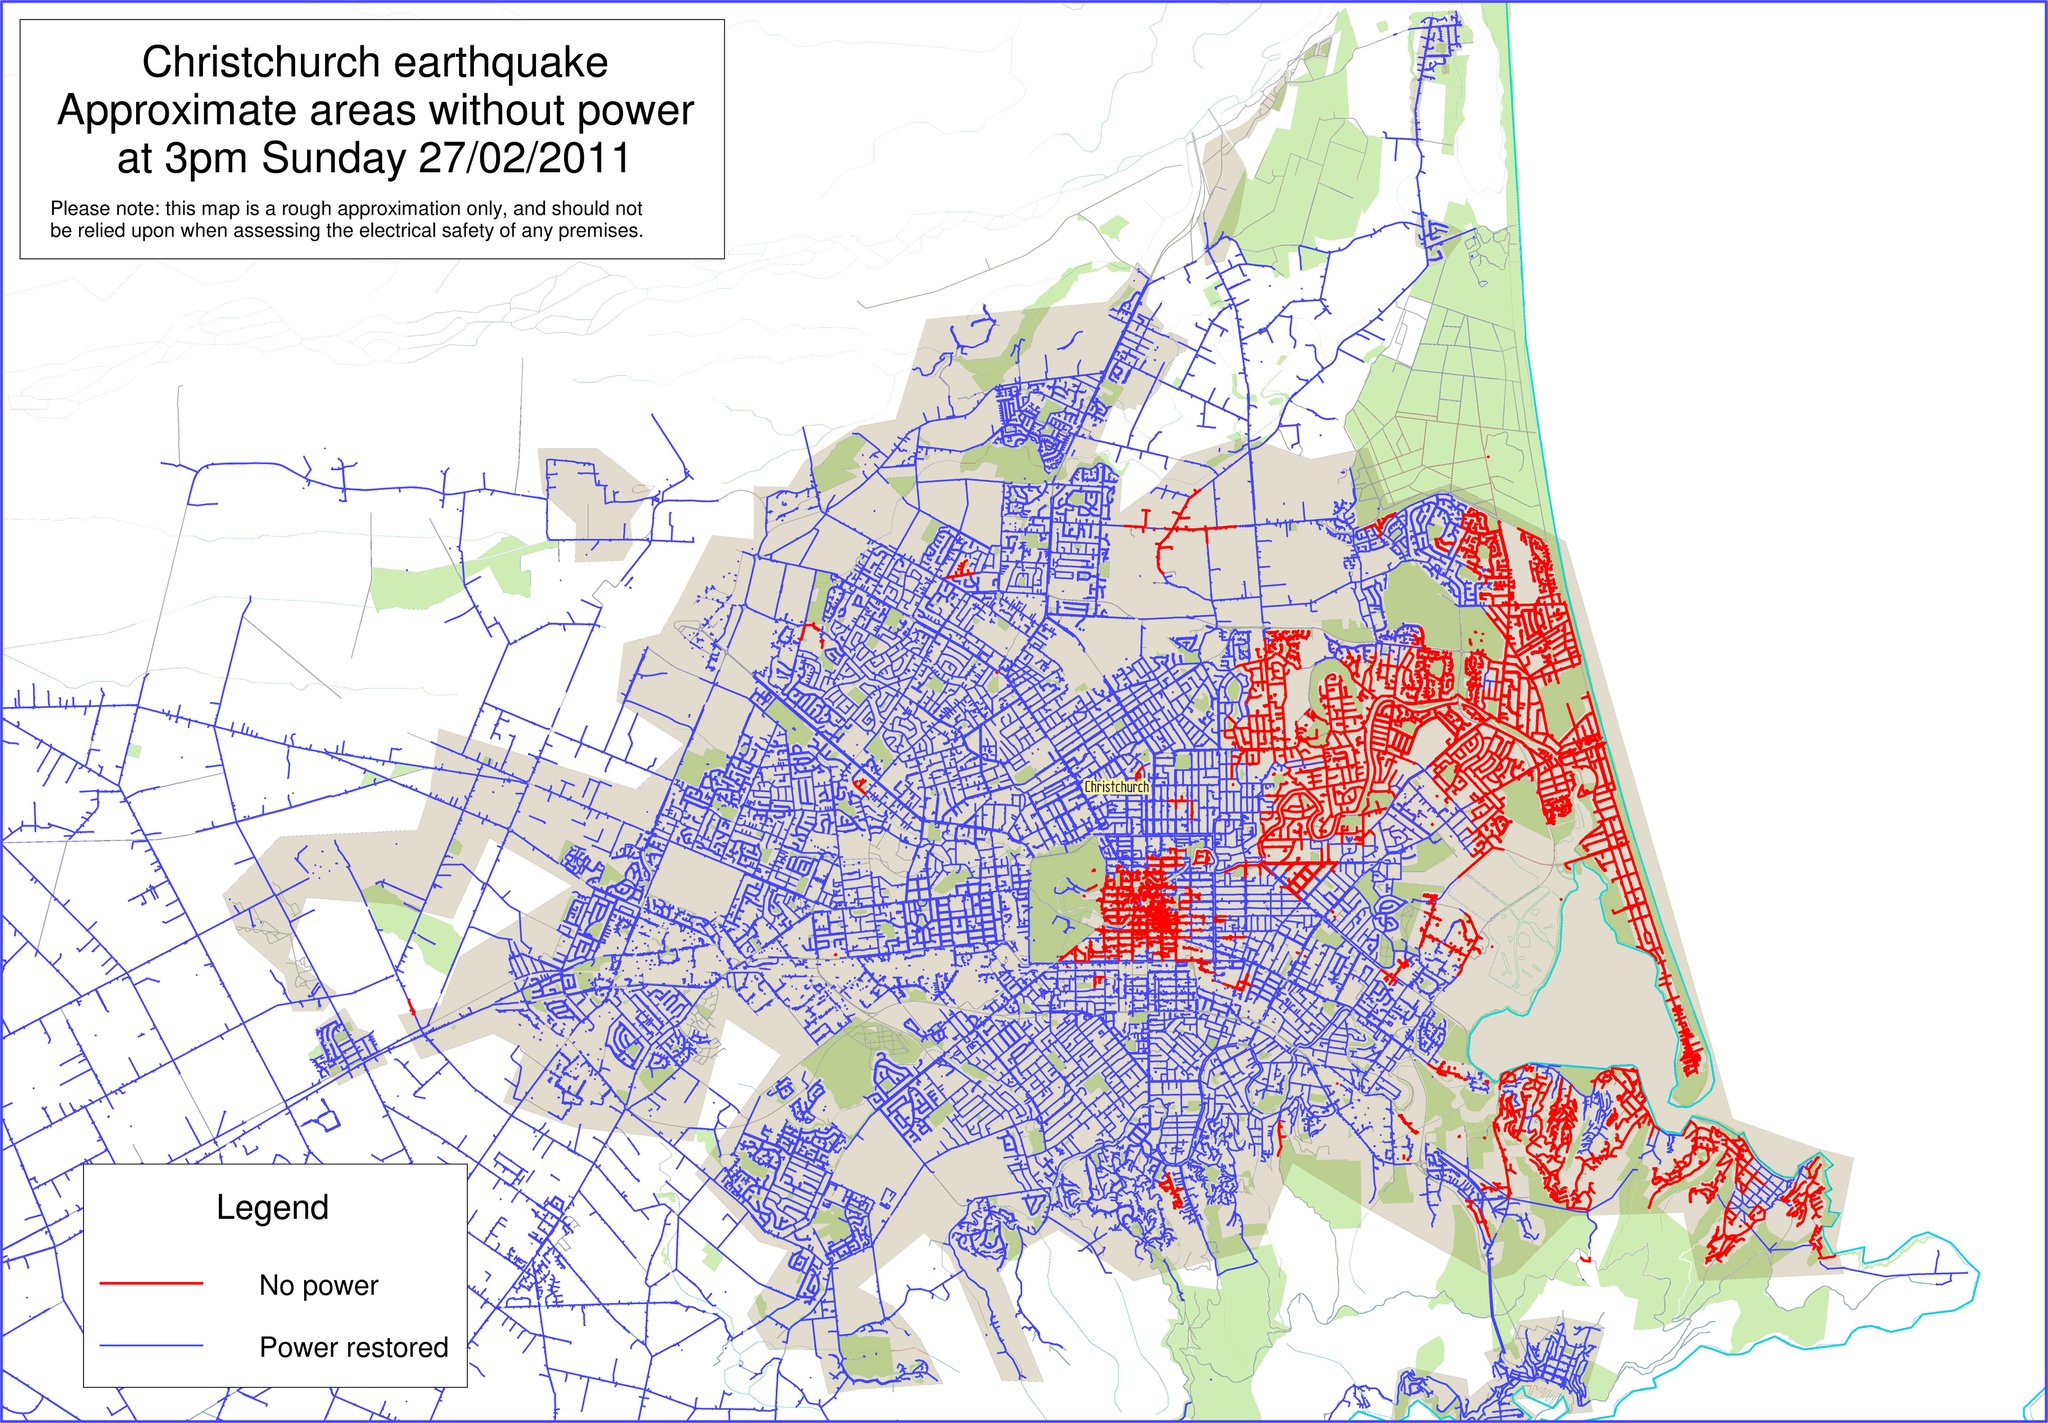
They are doing pretty well on restoring the power. With the exception of some small outlying areas, along the strike line and the CBD most of the city has power again as you can see from this chart (click to expand).
hat-tip: Jamie Gough via facebook wallpaper (has previous images day by day).
From the sequence, they have been concentrating on the the areas that require the least effort to complete to return power to the maximum number of people. At a guess it will probably take some time on the major remaining areas simply because these are the areas that had the most vertical acceleration during the quake.
Does anyone know if there are equivalent maps of the water, sewerage, and telecoms ?
Powered by WPtouch Mobile Suite for WordPress