 Digested Read – Spirit Level 4: Other Social Problems
Written By:
- Date published:
12:22 pm, September 25th, 2010 - 40 comments
Categories: equality -
Tags: spirit level
Digested Read Digested – Equality: better education and social mobility. Inequality: more teen pregnancies
Education is the future – it will be what creates or destroys the success of our society when the next generation has its turn to lead. So what produces the best outcomes? Good teachers in innovative classrooms, to be sure; but much more than that parental support. Parents with higher incomes and more education themselves have children who do better – but direct parental involvement is even more important. In turn children who do better at school will not just earn more, they will be more satisfied with their jobs, are far less likely to end up in prison, and more likely to be healthy and vote. How do we get this outcome for more of our children?

Although New Zealand does quite well at education, in general more equal societies do better. And they do better across the board. New Zealand and the UK’s reading scores are very high for a few who pull the average up – Scandinavian countries are much more consistent. Indeed in some research there’s a suspicion of under-representation of lower socio-economic groups in NZ and UK helping raise the average.
There are good reasons for more equal societies doing better. Parents will do better with more support – and more equal societies tend to provide that. Maternity leave is just the most obvious example: in the US & Australia there is no paid maternity leave at all, and in the US a woman may take only 12 weeks unpaid. In Sweden 18 months of parental leave at 80% of salary may be taken by either parent (or split between them).
And the results of that support and the difference in income can be stark: a UK study showed that 3 year-olds from disadvantaged homes were already 1 year behind in their development compared to those from privileged households.
The psychological effects matter too – in blind studies lower socio-economic children do better (and the wealthy worse), than in studies where status is made clear before children take the tests. Also interesting from a psychological point of view: although their educational results were better than less equal countries, more 15 year-olds aspire to less skilled work in more equal countries (eg 50% in Japan vs 15% in the US). The result being that those who cannot achieve university education are much happier with their lot as those jobs are not so stigmatised.
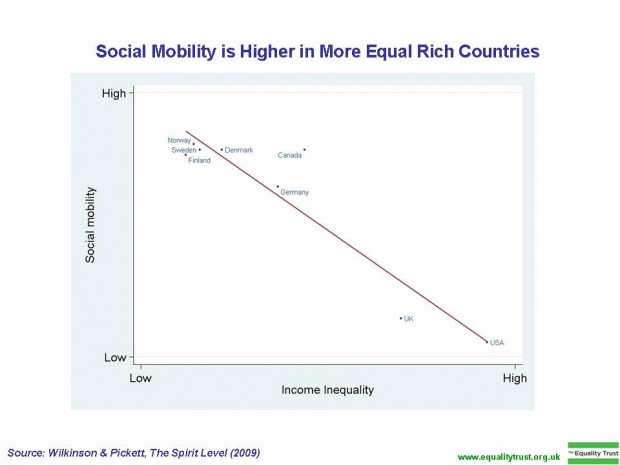
The American Dream says that anyone can grow up to do anything. But in fact social mobility is incredibly low in the US – if your father wasn’t wealthy, it’s highly unlikely you will be.
The number of countries with data here is low, which leads us to be cautious; but there has also been a large decrease in social mobility in the UK and US since 1980 – the same period that inequality has massively increased in those countries.
So far from inequality creating ‘incentives’ for people to move up, it instead creates sinkholes from which they cannot climb out.
The main driver of social mobility seems to be education – the connection to inequality of that is seen above – and in particular, publicly-funded education. The level of public-funding of education is in turn tightly correlated to inequality.
Another result of inequality and lack of social mobility has been that those ‘sinkholes’ have become geographical. As the wealthy move into gated communities, the poor end up left in ghettoes. And those economically disadvantaged end up doubly so when they are surrounded by people in the same boat. With the whole community lacking in resources, schools suffer, education outcomes suffer and social immobility is further enforced. Crime and violence are often left as the only way forward.
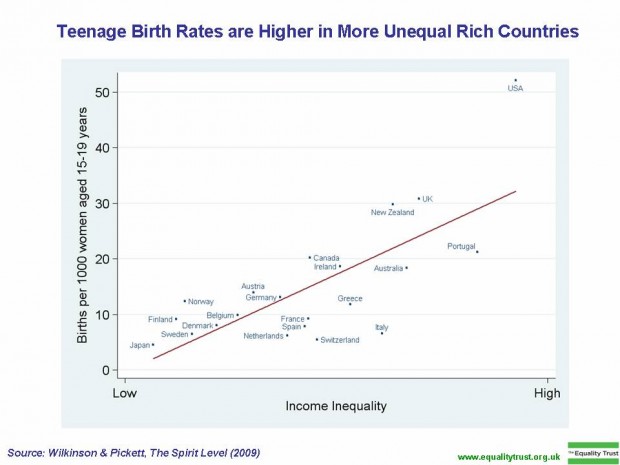
I mentioned the strong link over time for teen pregnancy rates vs inequality in the US in my previous post, but here’s the graph for between countries. It’s teen pregnancy births which is slightly affected by abortion rates, but a similar graph of the US states for conceptions shows a roughly parallel correlation. Indeed the biggest difference between conceptions and abortions is for the wealthier half of society – they are far more likely to abort and keep their own future prospects improved, where the poor are likely not to expect any good prospects anyway.
Even within the statistics hides a worse picture for unequal countries: in Japan, Italy and Greece, more than half of the teen pregnancies are within marriage (86% in Japan), where in NZ, US and UK that figure is less than a quarter. Another interesting statistic is that overall birth rates appear unaffected by inequality – suggesting fewer older mums to balance out the greater number of younger ones.
So why do less equal societies have more unmarried young mums – ‘babies having babies’? Like the young male violence it seems this is the only way these young women know how to gain status and adulthood. In turn they likely ruin both their own life chances (of education, work, social mobility, wealth…) and their children’s – those born to a teenage mother are much more likely to become one.
Absent fathers have a large part to play as well. Girls who grow up without a father are much more likely to become a teenage mother. But those young fathers from deprived backgrounds are unlikely to be able to offer much stability, income or support – and they have their own battles with inequality to occupy them. So the young mums console themselves with a strong relationship with their baby – their best chance of intimacy in their chaotic lives.
Next Friday: Sustainability.
–
For more detail: Read the book. Buy it and/or support the Trust.
Right-wing trolls: r0b had a recent post with links refuting the arguments you’re about to make…
40 comments on “Digested Read – Spirit Level 4: Other Social Problems ”
- Comments are now closed
Links to post
- Comments are now closed
Recent Comments
- A who’s who of New Zealand’s dodgiest companies
 Submissions on National's corrupt Muldoonist fast-track law are due today (have you submitted?), and just hours before they close, Infrastructure Minister Chris Bishop has been forced to release the list of companies he invited to apply. I've spent the last hour going through it in an epic thread of bleats, ...1 hour ago
 - On Lee’s watch, Economic Development seems to be stuck on scoring points from promoting sporting e...
 Buzz from the Beehive A few days ago, Point of Order suggested the media must be musing “on why Melissa is mute”. Our article reported that people working in the beleaguered media industry have cause to yearn for a minister as busy as Melissa Lee’s ministerial colleagues and we drew ...2 hours ago
 - New Zealand has never been closed for business
 1. What was The Curse of Jim Bolger?a. Winston Peters b. Soon after shaking his hand, world leaders would mysteriously lose office or shuffle off this mortal coilc. Could never shake off the Mother of All Budgetsd. Dandruff2. True or false? The Chairman of a Kiwi export business has asked the ...3 hours ago
 - Stop the panic – we’ve been here before
 Jack Vowles writes – New Zealand is said to be suffering from ‘serious populist discontent’. An IPSOS MORI survey has reported that we have an increasing preference for strong leaders, think that the economy is rigged toward the rich and powerful, and political elites are ignoring ‘hard-working people’. ...6 hours ago
 - Melissa Lee and the media: ending the questChris Trotter writes – MELISSA LEE should be deprived of her ministerial warrant. Her handling – or non-handling – of the crisis engulfing the New Zealand news media has been woeful. The fate of New Zealand’s two linear television networks, a question which the Minister of Broadcasting, Communications ...7 hours ago
- The Hoon around the week to April 19TL;DR: The podcast above features co-hosts and , along with regular guests Robert Patman on Gaza and AUKUS II, and on climate change.The six things that mattered in Aotearoa’s political economy that we wrote and spoke about via The Kākā and elsewhere for paying subscribers in the ...7 hours ago
- The ‘Humpty Dumpty’ end result of dismantling our environmental protectionsPolicymakers rarely wish to make plain or visible their desire to dismantle environmental policy, least of all to the young. Photo: Lynn GrievesonTL;DR: Here’s the top five news items of note in climate news for Aotearoa-NZ this week, and a discussion above between Bernard Hickey and The Kākā’s climate correspondent ...8 hours ago
- Nicola's Salad Days.
 I like to keep an eye on what’s happening in places like the UK, the US, and over the ditch with our good mates the Aussies. Let’s call them AUKUS, for want of a better collective term. More on that in a bit.It used to be, not long ago, that ...9 hours ago
 - Study sees climate change baking in 19% lower global income by 20509 hours ago
- Weekly Roundup 19-April-2024
 It’s Friday again. Here’s some of the things that caught our attention this week. This Week on Greater Auckland On Tuesday Matt covered at the government looking into a long tunnel for Wellington. On Wednesday we ran a post from Oscar Simms on some lessons from Texas. AT’s ...10 hours ago
 - Jack Vowles: Stop the panic – we’ve been here before
 New Zealand is said to be suffering from ‘serious populist discontent’. An IPSOS MORI survey has reported that we have an increasing preference for strong leaders, think that the economy is rigged toward the rich and powerful, and political elites are ignoring ‘hard-working people’. The data is from February this ...12 hours ago
 - Clearing up confusion (or trying to)
 Foreign Minister Winston Peters is understood to be planning a major speech within the next fortnight to clear up the confusion over whether or not New Zealand might join the AUKUS submarine project. So far, there have been conflicting signals from the Government. RNZ reported the Prime Minister yesterday in ...13 hours ago
 - How to Retrieve Deleted Call Log iPhone Without Computer
 How to Retrieve Deleted Call Log on iPhone Without a Computer: A Step–by–Step Guide Losing your iPhone call history can be frustrating, especially when you need to find a specific number or recall an important conversation. But before you panic, know that there are ways to retrieve deleted call logs on your iPhone, even without a computer. This guide will explore various methods, ranging from simple checks to utilizing iCloud backups and third–party applications. So, let‘s dive in and recover those lost calls! 1. Check Recently Deleted Folder: Apple understands that accidental deletions happen. That‘s why they introduced the “Recently Deleted“ folder for various apps, including the Phone app. This folder acts as a safety net, storing deleted call logs for up to 30 days before permanently erasing them. Here‘s how to check it: Open the Phone app on your iPhone. Tap on the “Recents“ tab at the bottom. Scroll to the top and tap on “Edit“. Select “Show Recently Deleted“. Browse the list to find the call logs you want to recover. Tap on the desired call log and choose “Recover“ to restore it to your call history. 2. Restore from iCloud Backup: If you regularly back up your iPhone to iCloud, you might be able to retrieve your deleted call log from a previous backup. However, keep in mind that this process will restore your entire phone to the state it was in at the time of the backup, potentially erasing any data added since then. Here‘s how to restore from an iCloud backup: Go to Settings > General > Reset. Choose “Erase All Content and Settings“. Follow the on–screen instructions. Your iPhone will restart and show the initial setup screen. Choose “Restore from iCloud Backup“ during the setup process. Select the relevant backup that contains your deleted call log. Wait for the restoration process to complete. 3. Explore Third–Party Apps (with Caution): ...15 hours ago
 - How to Factory Reset iPhone without Computer: A Comprehensive Guide to Restoring your DeviceLife throws curveballs, and sometimes, those curveballs necessitate wiping your iPhone clean and starting anew. Whether you’re facing persistent software glitches, preparing to sell your device, or simply wanting a fresh start, knowing how to factory reset iPhone without a computer is a valuable skill. While using a computer with ...21 hours ago
- How to Call Someone on a Computer: A Guide to Voice and Video Communication in the Digital AgeGone are the days when communication was limited to landline phones and physical proximity. Today, computers have become powerful tools for connecting with people across the globe through voice and video calls. But with a plethora of applications and methods available, how to call someone on a computer might seem ...22 hours ago
- Skeptical Science New Research for Week #16 2024
 Open access notables Glacial isostatic adjustment reduces past and future Arctic subsea permafrost, Creel et al., Nature Communications: Sea-level rise submerges terrestrial permafrost in the Arctic, turning it into subsea permafrost. Subsea permafrost underlies ~ 1.8 million km2 of Arctic continental shelf, with thicknesses in places exceeding 700 m. Sea-level variations over glacial-interglacial cycles control ...22 hours ago
 - Where on a Computer is the Operating System Generally Stored? Delving into the Digital Home of your ...The operating system (OS) is the heart and soul of a computer, orchestrating every action and interaction between hardware and software. But have you ever wondered where on a computer is the operating system generally stored? The answer lies in the intricate dance between hardware and software components, particularly within ...23 hours ago
- How Many Watts Does a Laptop Use? Understanding Power Consumption and EfficiencyLaptops have become essential tools for work, entertainment, and communication, offering portability and functionality. However, with rising energy costs and growing environmental concerns, understanding a laptop’s power consumption is more important than ever. So, how many watts does a laptop use? The answer, unfortunately, isn’t straightforward. It depends on several ...23 hours ago
- How to Screen Record on a Dell Laptop A Guide to Capturing Your Screen with EaseScreen recording has become an essential tool for various purposes, such as creating tutorials, capturing gameplay footage, recording online meetings, or sharing information with others. Fortunately, Dell laptops offer several built-in and external options for screen recording, catering to different needs and preferences. This guide will explore various methods on ...23 hours ago
- How Much Does it Cost to Fix a Laptop Screen? Navigating Repair Options and CostsA cracked or damaged laptop screen can be a frustrating experience, impacting productivity and enjoyment. Fortunately, laptop screen repair is a common service offered by various repair shops and technicians. However, the cost of fixing a laptop screen can vary significantly depending on several factors. This article delves into the ...23 hours ago
- How Long Do Gaming Laptops Last? Demystifying Lifespan and Maximizing LongevityGaming laptops represent a significant investment for passionate gamers, offering portability and powerful performance for immersive gaming experiences. However, a common concern among potential buyers is their lifespan. Unlike desktop PCs, which allow for easier component upgrades, gaming laptops have inherent limitations due to their compact and integrated design. This ...23 hours ago
- Climate Change: Turning the tideThe annual inventory report of New Zealand's greenhouse gas emissions has been released, showing that gross emissions have dropped for the third year in a row, to 78.4 million tons: All-told gross emissions have decreased by over 6 million tons since the Zero Carbon Act was passed in 2019. ...1 day ago
- How to Unlock Your Computer A Comprehensive Guide to Regaining AccessExperiencing a locked computer can be frustrating, especially when you need access to your files and applications urgently. The methods to unlock your computer will vary depending on the specific situation and the type of lock you encounter. This guide will explore various scenarios and provide step-by-step instructions on how ...1 day ago
- Faxing from Your Computer A Modern Guide to Sending Documents DigitallyWhile the world has largely transitioned to digital communication, faxing still holds relevance in certain industries and situations. Fortunately, gone are the days of bulky fax machines and dedicated phone lines. Today, you can easily send and receive faxes directly from your computer, offering a convenient and efficient way to ...1 day ago
- Protecting Your Home Computer A Guide to Cyber AwarenessIn our increasingly digital world, home computers have become essential tools for work, communication, entertainment, and more. However, this increased reliance on technology also exposes us to various cyber threats. Understanding these threats and taking proactive steps to protect your home computer is crucial for safeguarding your personal information, finances, ...1 day ago
- Server-Based Computing Powering the Modern Digital LandscapeIn the ever-evolving world of technology, server-based computing has emerged as a cornerstone of modern digital infrastructure. This article delves into the concept of server-based computing, exploring its various forms, benefits, challenges, and its impact on the way we work and interact with technology. Understanding Server-Based Computing: At its core, ...1 day ago
- Vroom vroom go the big red trucks
 The absolute brass neck of this guy.We want more medical doctors, not more spin doctors, Luxon was saying a couple of weeks ago, and now we’re told the guy has seven salaried adults on TikTok duty. Sorry, doing social media. The absolute brass neck of it. The irony that the ...1 day ago
 - Jones finds $410,000 to help the government muscle in on a spat projectBuzz from the Beehive Oceans and Fisheries Minister Shane Jones relishes spatting and eagerly takes issue with environmentalists who criticise his enthusiasm for resource development. He relishes helping the fishing industry too. And so today, while the media are making much of the latest culling in the public service to ...1 day ago
- Again, hate crimes are not necessarily terrorism.
 Having written, taught and worked for the US government on issues involving unconventional warfare and terrorism for 30-odd years, two things irritate me the most when the subject is discussed in public. The first is the Johnny-come-lately academics-turned-media commentators who … Continue reading ...1 day ago
 - Despair – construction consenting editionEric Crampton writes – Kainga Ora is the government’s house building agency. It’s been building a lot of social housing. Kainga Ora has its own (but independent) consenting authority, Consentium. It’s a neat idea. Rather than have to deal with building consents across each different territorial authority, Kainga Ora ...1 day ago
- Coalition promises – will the Govt keep the commitment to keep Kiwis equal before the law?Muriel Newman writes – The Coalition Government says it is moving with speed to deliver campaign promises and reverse the damage done by Labour. One of their key commitments is to “defend the principle that New Zealanders are equal before the law.” To achieve this, they have pledged they “will not advance ...1 day ago
- An impermanent public service is a guarantee of very little else but failureChris Trotter writes – The absence of anything resembling a fightback from the public servants currently losing their jobs is interesting. State-sector workers’ collective fatalism in the face of Coalition cutbacks indicates a surprisingly broad acceptance of impermanence in the workplace. Fifty years ago, lay-offs in the thousands ...1 day ago
- What happens after the war – Mariupol
 Mariupol, on the Azov Sea coast, was one of the first cities to suffer almost complete destruction after the start of the Ukraine War started in late February 2022. We remember the scenes of absolute destruction of the houses and city structures. The deaths of innocent civilians – many of ...1 day ago
 - Babies and benefits – no good newsLindsay Mitchell writes – Ten years ago, I wrote the following in a Listener column: Every year around one in five new-born babies will be reliant on their caregivers benefit by Christmas. This pattern has persisted from at least 1993. For Maori the number jumps to over one in three. ...1 day ago
- Should the RBNZ be looking through climate inflation?
 1 day ago
 - Bernard's pick 'n' mix of the news links
 The top six news links I’ve seen elsewhere in the last 24 hours, as of 9:16 am on Thursday, April 18 are:Housing: Tauranga residents living in boats, vans RNZ Checkpoint Louise TernouthHousing: Waikato councillor says wastewater plant issues could hold up Sleepyhead building a massive company town Waikato Times Stephen ...1 day ago
 - Gordon Campbell on the public sector carnage, and misogyny as terrorismIt’s a simple deal. We pay taxes in order to finance the social services we want and need. The carnage now occurring across the public sector though, is breaking that contract. Over 3,000 jobs have been lost so far. Many are in crucial areas like Education where the impact of ...1 day ago
- Meeting the Master Baiters
 Hi,A friend had their 40th over the weekend and decided to theme it after Curb Your Enthusiasm fashion icon Susie Greene. Captured in my tiny kitchen before I left the house, I ending up evoking a mix of old lesbian and Hillary Clinton — both unintentional.Me vs Hillary ClintonIf you’re ...2 days ago
 - How extreme was the Earth's temperature in 2023This is a re-post from Andrew Dessler at the Climate Brink blog In 2023, the Earth reached temperature levels unprecedented in modern times. Given that, it’s reasonable to ask: What’s going on? There’s been lots of discussions by scientists about whether this is just the normal progression of global warming or if something ...2 days ago
- Backbone, revisited
 The schools are on holiday and the sun is shining in the seaside village and all day long I have been seeing bunches of bikes; Mums, Dads, teens and toddlers chattering, laughing, happy, having a bloody great time together. Cheers, AT, for the bits of lane you’ve added lately around the ...2 days ago
 - Ministers are not above the lawToday in our National-led authoritarian nightmare: Shane Jones thinks Ministers should be above the law: New Zealand First MP Shane Jones is accusing the Waitangi Tribunal of over-stepping its mandate by subpoenaing a minister for its urgent hearing on the Oranga Tamariki claim. The tribunal is looking into the ...2 days ago
- What’s the outfit you can hear going down the gurgler? Probably it’s David Parker’s Oceans Sec...Buzz from the Beehive Point of Order first heard of the Oceans Secretariat in June 2021, when David Parker (remember him?) announced a multi-agency approach to protecting New Zealand’s marine ecosystems and fisheries. Parker (holding the Environment, and Oceans and Fisheries portfolios) broke the news at the annual Forest & ...2 days ago
- Will politicians let democracy die in the darkness?Bryce Edwards writes – Politicians across the political spectrum are implicated in the New Zealand media’s failing health. Either through neglect or incompetent interventions, successive governments have failed to regulate, foster, and allow a healthy Fourth Estate that can adequately hold politicians and the powerful to account. ...2 days ago
- Matt Doocey doubles down on trans “healthcare”Citizen Science writes – Last week saw two significant developments in the debate over the treatment of trans-identifying children and young people – the release in Britain of the final report of Dr Hilary Cass’s review into gender healthcare, and here in New Zealand, the news that the ...2 days ago
- A TikTok Prime Minister.
 One night while sleeping in my bed I had a beautiful dreamThat all the people of the world got together on the same wavelengthAnd began helping one anotherNow in this dream, universal love was the theme of the dayPeace and understanding and it happened this wayAfter such an eventful day ...2 days ago
 - Texas LessonsThis is a guest post by Oscar Simms who is a housing activist, volunteer for the Coalition for More Homes, and was the Labour Party candidate for Auckland Central at the last election.
...
2 days ago - Bernard's pick 'n' mix of the news links at 6:06 am
 The top six news links I’ve seen elsewhere in the last 24 hours as of 6:06 am on Wednesday, April 17 are:Must read: Secrecy shrouds which projects might be fast-tracked RNZ Farah HancockScoop: Revealed: Luxon has seven staffers working on social media content - partly paid for by taxpayer Newshub ...2 days ago
 - Fighting poverty on the holiday highwayTurning what Labour called the “holiday highway” into a four-lane expressway from Auckland to Whangarei could bring at least an economic benefit of nearly two billion a year for Northland each year. And it could help bring an end to poverty in one of New Zealand’s most deprived regions. The ...3 days ago
- Bernard's six-stack of substacks at 6:26 pm
 Tonight’s six-stack includes: launching his substack with a bunch of his previous documentaries, including this 1992 interview with Dame Whina Cooper. and here crew give climate activists plenty to do, including this call to submit against the Fast Track Approvals bill. writes brilliantly here on his substack ...3 days ago
 - At a glance – Is the science settled?On February 14, 2023 we announced our Rebuttal Update Project. This included an ask for feedback about the added "At a glance" section in the updated basic rebuttal versions. This weekly blog post series highlights this new section of one of the updated basic rebuttal versions and serves as a ...3 days ago
- Apposite Quotations.
 3 days ago
 - What’s a life worth now?
 You're in the mall when you hear it: some kind of popping sound in the distance, kids with fireworks, maybe. But then a moment of eerie stillness is followed by more of the fireworks sound and there’s also screaming and shrieking and now here come people running for their lives.Does ...3 days ago
 - Howling at the MoonKarl du Fresne writes – There’s a crisis in the news media and the media are blaming it on everyone except themselves. Culpability is being deflected elsewhere – mainly to the hapless Minister of Communications, Melissa Lee, and the big social media platforms that are accused of hoovering ...3 days ago
- Newshub is Dead.
 I don’t normally send out two newsletters in a day but I figured I’d say something about… the news. If two newsletters is a bit much then maybe just skip one, I don’t want to overload people. Alternatively if you’d be interested in sometimes receiving multiple, smaller updates from me, ...3 days ago
 - Seymour is chuffed about cutting early-learning red tape – but we hear, too, that Jones has loose...Buzz from the Beehive David Seymour and Winston Peters today signalled that at least two ministers of the Crown might be in Wellington today. Seymour (as Associate Minister of Education) announced the removal of more red tape, this time to make it easier for new early learning services to be ...3 days ago
- Bryce Edwards: Will politicians let democracy die in the darkness?Politicians across the political spectrum are implicated in the New Zealand media’s failing health. Either through neglect or incompetent interventions, successive governments have failed to regulate, foster, and allow a healthy Fourth Estate that can adequately hold politicians and the powerful to account. Our political system is suffering from the ...3 days ago
- Was Hawkesby entirely wrong?David Farrar writes – The Broadcasting Standards Authority ruled: Comments by radio host Kate Hawkesby suggesting Māori and Pacific patients were being prioritised for surgery due to their ethnicity were misleading and discriminatory, the Broadcasting Standards Authority has found. It is a fact such patients are prioritised. ...3 days ago
- PRC shadow looms as the Solomons head for electionPRC and its proxies in Solomons have been preparing for these elections for a long time. A lot of money, effort and intelligence have gone into ensuring an outcome that won’t compromise Beijing’s plans. Cleo Paskall writes – On April 17th the Solomon Islands, a country of ...3 days ago
- Climate Change: Criminal ecocideWe are in the middle of a climate crisis. Last year was (again) the hottest year on record. NOAA has just announced another global coral bleaching event. Floods are threatening UK food security. So naturally, Shane Jones wants to make it easier to mine coal: Resources Minister Shane Jones ...3 days ago
- Is saving one minute of a politician's time worth nearly $1 billion?Is speeding up the trip to and from Wellington airport by 12 minutes worth spending up more than $10 billion? Photo: Lynn Grieveson / The KākāTL;DR: The six news items that stood out to me in the last day to 8:26 am today are:The Lead: Transport Minister Simeon Brown announced ...3 days ago
- Long Tunnel or Long Con?Yesterday it was revealed that Transport Minister had asked Waka Kotahi to look at the options for a long tunnel through Wellington. State Highway 1 (SH1) through Wellington City is heavily congested at peak times and while planning continues on the duplicate Mt Victoria Tunnel and Basin Reserve project, the ...3 days ago
- Smoke And Mirrors.
 You're a fraud, and you know itBut it's too good to throw it all awayAnyone would do the sameYou've got 'em goingAnd you're careful not to show itSometimes you even fool yourself a bitIt's like magicBut it's always been a smoke and mirrors gameAnyone would do the sameForty six billion ...3 days ago
 - What is Mexico doing about climate change?This is a re-post from Yale Climate Connections The June general election in Mexico could mark a turning point in ensuring that the country’s climate policies better reflect the desire of its citizens to address the climate crisis, with both leading presidential candidates expressing support for renewable energy. Mexico is the ...4 days ago
- State of humanity, 2024
 2024, it feels, keeps presenting us with ever more challenges, ever more dismay.Do you give up yet? It seems to ask.No? How about this? Or this?How about this?When I say 2024 I really mean the state of humanity in 2024.Saturday night, we watched Civil War because that is one terrifying cliff we've ...4 days ago
 - Govt’s Wellington tunnel vision aims to ease the way to the airport (but zealous promoters of cycl...Buzz from the Beehive A pet project and governmental tunnel vision jump out from the latest batch of ministerial announcements. The government is keen to assure us of its concern for the wellbeing of our pets. It will be introducing pet bonds in a change to the Residential Tenancies Act ...4 days ago
- The case for cultural connectednessA recent report generated from a Growing Up in New Zealand (GUiNZ) survey of 1,224 rangatahi Māori aged 11-12 found: Cultural connectedness was associated with fewer depression symptoms, anxiety symptoms and better quality of life. That sounds cut and dry. But further into the report the following appears: Cultural connectedness is ...4 days ago
- Useful context on public sector job cutsDavid Farrar writes – The Herald reports: From the gory details of job-cuts news, you’d think the public service was being eviscerated. While the media’s view of the cuts is incomplete, it’s also true that departments have been leaking the particulars faster than a Wellington ...4 days ago
- Gordon Campbell On When Racism Comes Disguised As Anti-racismRemember the good old days, back when New Zealand had a PM who could think and speak calmly and intelligently in whole sentences without blustering? Even while Iran’s drones and missiles were still being launched, Helen Clark was live on TVNZ expertly summing up the latest crisis in the Middle ...4 days ago
- Govt ignored economic analysis of smokefree reversal4 days ago
- True Blue.
 True loveYou're the one I'm dreaming ofYour heart fits me like a gloveAnd I'm gonna be true blueBaby, I love youI’ve written about the job cuts in our news media last week. The impact on individuals, and the loss to Aotearoa of voices covering our news from different angles.That by ...4 days ago
 - Who is running New Zealand’s foreign policy?While commentators, including former Prime Minister Helen Clark, are noting a subtle shift in New Zealand’s foreign policy, which now places more emphasis on the United States, many have missed a key element of the shift. What National said before the election is not what the government is doing now. ...5 days ago
- 2024 SkS Weekly Climate Change & Global Warming News Roundup #15A listing of 31 news and opinion articles we found interesting and shared on social media during the past week: Sun, April 7, 2024 thru Sat, April 13, 2024. Story of the week Our story of the week is about adults in the room setting terms and conditions of ...5 days ago
- Feline Friends and Fragile Fauna The Complexities of Cats in New Zealand’s Conservation Efforts
Cats, with their independent spirit and beguiling purrs, have captured the hearts of humans for millennia. In New Zealand, felines are no exception, boasting the highest national cat ownership rate globally [definition cat nz cat foundation]. An estimated 1.134 million pet cats grace Kiwi households, compared to 683,000 dogs ...
5 days ago - Or is that just they want us to think?
 Nice guy, that Peter Williams. Amiable, a calm air of no-nonsense capability, a winning smile. Everything you look for in a TV presenter and newsreader.I used to see him sometimes when I went to TVNZ to be a talking head or a panellist and we would yarn. Nice guy, that ...5 days ago
 - Fact Brief – Did global warming stop in 1998?Skeptical Science is partnering with Gigafact to produce fact briefs — bite-sized fact checks of trending claims. This fact brief was written by Sue Bin Park in collaboration with members from our Skeptical Science team. You can submit claims you think need checking via the tipline. Did global warming stop in ...6 days ago
- Fast-track submissions period must be extended
 The Green Party has joined the call for public submissions on the fast-track legislation to be extended after the Ombudsman forced the Government to release the list of organisations invited to apply just hours before submissions close. ...1 hour ago
 - Release: Progress on climate will be undone by Govt
 New Zealand’s good work at reducing climate emissions for three years in a row will be undone by the National government’s lack of ambition and scrapping programmes that were making a difference, Labour Party climate spokesperson Megan Woods said today. ...2 hours ago
 - Release: Dark day for Kiwi kids as a third of Govt cuts affect themNews that 1000 jobs at the Ministry of Education and Oranga Tamariki could go is devastating for future generations of New Zealanders. ...2 days ago
- Release: Alarm as Government signals further blow to school lunchesMore essential jobs could be on the chopping block, this time Ministry of Education staff on the school lunches team are set to find out whether they're in line to lose their jobs. ...2 days ago
- Release: Quick, submit – stop Govt’s dodgy approvals billThe Government is trying to bring in a law that will allow Ministers to cut corners and kill off native species, Labour environment spokesperson Rachel Brooking said. ...3 days ago
- Government throws coal on the climate crisis fireThe Government’s policy announced today to ease consenting for coal mining will have a lasting impact across generations. ...3 days ago
- Release: Public transport costs to double as National looks at unaffordable roading project insteadCancelling urgently needed new Cook Strait ferries and hiking the cost of public transport for many Kiwis so that National can announce the prospect of another tunnel for Wellington is not making good choices, Labour Transport Spokesperson Tangi Utikere said. ...4 days ago
- Release: Cost of living in Auckland still not a priorityA laundry list of additional costs for Tāmaki Makarau Auckland shows the Minister for the city is not delivering for the people who live there, says Labour Auckland Issues spokesperson Shanan Halbert. ...4 days ago
- Greens look to fast-track submissions on harmful lawThe Green Party has today launched a step-by-step guide to help New Zealanders make their voice heard on the Government’s democracy dodging and anti-environment fast track legislation. ...1 week ago
- Release: Govt should stop making people’s lives harder and build more homesThe National Government’s proposed changes to the Residential Tenancies Act will mean tenants can be turfed from their homes by landlords with little notice, Labour housing spokesperson Kieran McAnulty said. ...1 week ago
- Release: Melissa Lee missing in action on mediaThe action Melissa Lee promised to protect democracy and the media sector is missing, Media and Communications spokesperson Willie Jackson said. ...1 week ago
- Landlord Government leaves little hope for rentersThe Government’s announcement on tenancy rules prove that it does not care about renters. ...1 week ago
- Opportunity to build a more sustainable economyGreen Party co-leader Marama Davidson is calling on all parties to support a common-sense change that’s great for the planet and great for consumers after her member’s bill was drawn from the ballot today. ...1 week ago
- Significant step forward in fixing cruel and unjust pastA significant milestone has been reached in the fight to strike an anti-Pasifika and unfair law from the country’s books after Teanau Tuiono’s members’ bill passed its first reading. ...1 week ago
- Missed opportunity but NZ will surely one day recognise the right to a sustainable environmentNew Zealand has today missed the opportunity to uphold the right to a clean, healthy, and sustainable environment, says James Shaw after his member’s bill was voted down in its first reading. ...1 week ago
- Release: Don’t cut our lunches – clear message sent to GovernmentTens of thousands of people are demanding the Government commits to fully funding free and healthy school lunches. ...1 week ago
- Release: Govt makes U-turn on Suicide Prevention OfficeLabour welcomes the Government’s U-turn on the closure of the Suicide Prevention Office, says Labour Mental Health spokesperson Ingrid Leary. ...1 week ago
- CCC issues warning over further climate delayToday’s advice from the Climate Change Commission paints a sobering reality of the challenge we face in combating climate change, especially in light of recent Government policy announcements. ...2 weeks ago
- Luxon targets lame and lousy example of leadershipIf talk is cheap, Chris Luxon’s “targets” are bankrupt. ...2 weeks ago
- Luxon targets are lousy example of leadershipIf talk is cheap, Chris Luxon’s “targets” are bankrupt. ...2 weeks ago
- Release: Commitment to disability communities missing from Govt prioritiesMinister for Disability Issues Penny Simmonds appears to have delayed a report back to Cabinet on the progress New Zealand is making against international obligations for disabled New Zealanders. ...2 weeks ago
- Methane target review is dangerous duplicationThe Government’s newly announced review of methane emissions reduction targets hints at its desire to delay Aotearoa New Zealand’s urgent transition to a climate safe future, the Green Party said. ...2 weeks ago
- Release: Government must commit to school building project for disabled studentsThe Government must commit to the Maitai School building project for students with high and complex needs, to ensure disabled students from the top of the South Island have somewhere to learn. ...2 weeks ago
- Release: National must take mental health seriouslyMental Health Minister Matt Doocey and his Government colleagues have made a meal of their mental health commitments, showing how flimsy their efforts to champion the issue truly are, says Labour Mental Health spokesperson Ingrid Leary. ...2 weeks ago
- Referendums for Māori wards a racist step backwardsThe Government's imposed referendum on Māori wards is a racist step backwards for Māori representation, and disregards Te Tiriti o Waitangi. ...2 weeks ago
- Release: Job losses at Health not worth it for tax cutsNew Zealand will feel the harm of the National Government’s reckless cuts to jobs at the health ministry for generations, says Ayesha Verrall. ...2 weeks ago
- Press release: No Māori initiatives in Government’s nothing planMāori are yet to see anything from this Government except cuts, reversals and taking our people backwards, Māori Development spokesperson Willie Jackson said. ...2 weeks ago
- Thirty six point PR spinThe Government’s ‘36 point’ plan for the next three months is as pointless as it is hollow. ...2 weeks ago
- Thirty six point PR spinThe Government’s ‘36 point’ plan for the next three months is as pointless as it is hollow. ...2 weeks ago
- Thirty six point PR spinThe Government’s ‘36 point’ plan for the next three months is as pointless as it is hollow. ...2 weeks ago
- Release: Social housing off Government’s to-do listThe Coalition Government’s refusal to commit to ongoing funding for social housing is seeing the sector pull back on developments and families watch their dreams of securing a home fade away, says Labour Housing spokesperson Kieran McAnulty. ...2 weeks ago
- Release: Less money in most people’s pockets this AprilChanges to minimum wage and benefit indexation means many New Zealanders will get less this year, as the Government gives a big tax break to landlords instead. ...3 weeks ago
- $41m to support clean energy in South East Asia
 New Zealand is demonstrating its commitment to reducing global greenhouse emissions, and supporting clean energy transition in South East Asia, through a contribution of NZ$41 million (US$25 million) in climate finance to the Asian Development Bank (ADB)-led Energy Transition Mechanism (ETM). Prime Minister Christopher Luxon and Climate Change Minister Simon Watts announced ...2 hours ago
 - Minister releases Fast-track stakeholder listThe Government is today releasing a list of organisations who received letters about the Fast-track applications process, says RMA Reform Minister Chris Bishop. “Recently Ministers and agencies have received a series of OIA requests for a list of organisations to whom I wrote with information on applying to have a ...4 hours ago
- Judicial appointments announcedAttorney-General Judith Collins today announced the appointment of Wellington Barrister David Jonathan Boldt as a Judge of the High Court, and the Honourable Justice Matthew Palmer as a Judge of the Court of Appeal. Justice Boldt graduated with an LLB from Victoria University of Wellington in 1990, and also holds ...4 hours ago
- Education Minister heads to major teaching summit in SingaporeEducation Minister Erica Stanford will lead the New Zealand delegation at the 2024 International Summit on the Teaching Profession (ISTP) held in Singapore. The delegation includes representatives from the Post Primary Teachers’ Association (PPTA) Te Wehengarua and the New Zealand Educational Institute (NZEI) Te Riu Roa. The summit is co-hosted ...5 hours ago
- Value of stopbank project proven during cycloneA stopbank upgrade project in Tairawhiti partly funded by the Government has increased flood resilience for around 7000ha of residential and horticultural land so far, Regional Development Minister Shane Jones says. Mr Jones today attended a dawn service in Gisborne to mark the end of the first stage of the ...5 hours ago
- Anzac commemorations, Türkiye relationship focus of visitForeign Affairs Minister Winston Peters will represent the Government at Anzac Day commemorations on the Gallipoli Peninsula next week and engage with senior representatives of the Turkish government in Istanbul. “The Gallipoli campaign is a defining event in our history. It will be a privilege to share the occasion ...6 hours ago
- Minister to Europe for OECD meeting, Anzac DayScience, Innovation and Technology and Defence Minister Judith Collins will next week attend the OECD Science and Technology Ministerial conference in Paris and Anzac Day commemorations in Belgium. “Science, innovation and technology have a major role to play in rebuilding our economy and achieving better health, environmental and social outcomes ...8 hours ago
- Comprehensive Partnership the goal for NZ and the PhilippinesPrime Minister Christopher Luxon held a bilateral meeting today with the President of the Philippines, Ferdinand Marcos Jr. The Prime Minister was accompanied by MP Paulo Garcia, the first Filipino to be elected to a legislature outside the Philippines. During today’s meeting, Prime Minister Luxon and President Marcos Jr discussed opportunities to ...19 hours ago
- Government commits $20m to Westport flood protectionThe Government has announced that $20 million in funding will be made available to Westport to fund much needed flood protection around the town. This measure will significantly improve the resilience of the community, says Local Government Minister Simeon Brown. “The Westport community has already been allocated almost $3 million ...1 day ago
- Taupō takes pole positionThe Government is proud to support the first ever Repco Supercars Championship event in Taupō as up to 70,000 motorsport fans attend the Taupō International Motorsport Park this weekend, says Economic Development Minister Melissa Lee. “Anticipation for the ITM Taupō Super400 is huge, with tickets and accommodation selling out weeks ...1 day ago
- Cost of living support for low-income homeownersLocal Government Minister Simeon Brown has announced an increase to the Rates Rebate Scheme, putting money back into the pockets of low-income homeowners. “The coalition Government is committed to bringing down the cost of living for New Zealanders. That includes targeted support for those Kiwis who are doing things tough, such ...1 day ago
- Government backing mussel spat projectThe Coalition Government is investing in a project to boost survival rates of New Zealand mussels and grow the industry, Oceans and Fisheries Minister Shane Jones has announced. “This project seeks to increase the resilience of our mussels and significantly boost the sector’s productivity,” Mr Jones says. “The project - ...1 day ago
- Government focused on getting people into workBenefit figures released today underscore the importance of the Government’s plan to rebuild the economy and have 50,000 fewer people on Jobseeker Support, Social Development and Employment Minister Louise Upston says. “Benefit numbers are still significantly higher than when National was last in government, when there was about 70,000 fewer ...1 day ago
- Clean energy key driver to reducing emissionsThe Government’s commitment to doubling New Zealand’s renewable energy capacity is backed by new data showing that clean energy has helped the country reach its lowest annual gross emissions since 1999, Climate Change Minister Simon Watts says. New Zealand’s latest Greenhouse Gas Inventory (1990-2022) published today, shows gross emissions fell ...1 day ago
- Earthquake-prone buildings review brought forwardThe Government is bringing the earthquake-prone building review forward, with work to start immediately, and extending the deadline for remediations by four years, Building and Construction Minister Chris Penk says. “Our Government is focused on rebuilding the economy. A key part of our plan is to cut red tape that ...2 days ago
- Thailand and NZ to agree to Strategic PartnershipPrime Minister Christopher Luxon and his Thai counterpart, Prime Minister Srettha Thavisin, have today agreed that New Zealand and the Kingdom of Thailand will upgrade the bilateral relationship to a Strategic Partnership by 2026. “New Zealand and Thailand have a lot to offer each other. We have a strong mutual desire to build ...2 days ago
- Government consults on extending coastal permits for portsRMA Reform Minister Chris Bishop and Transport Minister Simeon Brown have today announced the Coalition Government’s intention to extend port coastal permits for a further 20 years, providing port operators with certainty to continue their operations. “The introduction of the Resource Management Act in 1991 required ports to obtain coastal ...2 days ago
- Inflation coming down, but more work to doToday’s announcement that inflation is down to 4 per cent is encouraging news for Kiwis, but there is more work to be done - underlining the importance of the Government’s plan to get the economy back on track, acting Finance Minister Chris Bishop says. “Inflation is now at 4 per ...2 days ago
- School attendance restored as a priority in health adviceRefreshed health guidance released today will help parents and schools make informed decisions about whether their child needs to be in school, addressing one of the key issues affecting school attendance, says Associate Education Minister David Seymour. In recent years, consistently across all school terms, short-term illness or medical reasons ...2 days ago
- Unnecessary bureaucracy cut in oceans sectorOceans and Fisheries Minister Shane Jones is streamlining high-level oceans management while maintaining a focus on supporting the sector’s role in the export-led recovery of the economy. “I am working to realise the untapped potential of our fishing and aquaculture sector. To achieve that we need to be smarter with ...2 days ago
- Patterson promoting NZ’s wool sector at International CongressAssociate Agriculture Minister Mark Patterson is speaking at the International Wool Textile Organisation Congress in Adelaide, promoting New Zealand wool, and outlining the coalition Government’s support for the revitalisation the sector. "New Zealand’s wool exports reached $400 million in the year to 30 June 2023, and the coalition Government ...3 days ago
- Removing red tape to help early learners thriveThe Government is making legislative changes to make it easier for new early learning services to be established, and for existing services to operate, Associate Education Minister David Seymour says. The changes involve repealing the network approval provisions that apply when someone wants to establish a new early learning service, ...3 days ago
- RMA changes to cut coal mining consent red tapeChanges to the Resource Management Act will align consenting for coal mining to other forms of mining to reduce barriers that are holding back economic development, Resources Minister Shane Jones says. “The inconsistent treatment of coal mining compared with other extractive activities is burdensome red tape that fails to acknowledge ...3 days ago
- McClay reaffirms strong NZ-China trade relationshipTrade, Agriculture and Forestry Minister Todd McClay has concluded productive discussions with ministerial counterparts in Beijing today, in support of the New Zealand-China trade and economic relationship. “My meeting with Commerce Minister Wang Wentao reaffirmed the complementary nature of the bilateral trade relationship, with our Free Trade Agreement at its ...4 days ago
- Prime Minister Luxon acknowledges legacy of Singapore Prime Minister LeePrime Minister Christopher Luxon today paid tribute to Singapore’s outgoing Prime Minister Lee Hsien Loong. Meeting in Singapore today immediately before Prime Minister Lee announced he was stepping down, Prime Minister Luxon warmly acknowledged his counterpart’s almost twenty years as leader, and the enduring legacy he has left for Singapore and South East ...4 days ago
- PMs Luxon and Lee deepen Singapore-NZ tiesPrime Minister Christopher Luxon held a bilateral meeting today with Singapore Prime Minister Lee Hsien Loong. While in Singapore as part of his visit to South East Asia this week, Prime Minister Luxon also met with Singapore President Tharman Shanmugaratnam and will meet with Deputy Prime Minister Lawrence Wong. During today’s meeting, Prime Minister Luxon ...4 days ago
- Antarctica New Zealand Board appointmentsForeign Minister Winston Peters has made further appointments to the Board of Antarctica New Zealand as part of a continued effort to ensure the Scott Base Redevelopment project is delivered in a cost-effective and efficient manner. The Minister has appointed Neville Harris as a new member of the Board. Mr ...4 days ago
- Finance Minister travels to Washington DCFinance Minister Nicola Willis will travel to the United States on Tuesday to attend a meeting of the Five Finance Ministers group, with counterparts from Australia, the United States, Canada, and the United Kingdom. “I am looking forward to meeting with our Five Finance partners on how we can work ...4 days ago
- Pet bonds a win/win for renters and landlordsThe coalition Government has today announced purrfect and pawsitive changes to the Residential Tenancies Act to give tenants with pets greater choice when looking for a rental property, says Housing Minister Chris Bishop. “Pets are important members of many Kiwi families. It’s estimated that around 64 per cent of New ...4 days ago
- Long Tunnel for SH1 Wellington being consideredState Highway 1 (SH1) through Wellington City is heavily congested at peak times and while planning continues on the duplicate Mt Victoria Tunnel and Basin Reserve project, the Government has also asked NZ Transport Agency (NZTA) to consider and provide advice on a Long Tunnel option, Transport Minister Simeon Brown ...4 days ago
- New Zealand condemns Iranian strikesPrime Minister Christopher Luxon and Foreign Minister Winston Peters have condemned Iran’s shocking and illegal strikes against Israel. “These attacks are a major challenge to peace and stability in a region already under enormous pressure," Mr Luxon says. "We are deeply concerned that miscalculation on any side could ...5 days ago
- Huge interest in Government’s infrastructure plansHundreds of people in little over a week have turned out in Northland to hear Regional Development Minister Shane Jones speak about plans for boosting the regional economy through infrastructure. About 200 people from the infrastructure and associated sectors attended an event headlined by Mr Jones in Whangarei today. Last ...1 week ago
- Health Minister thanks outgoing Health New Zealand ChairHealth Minister Dr Shane Reti has today thanked outgoing Health New Zealand – Te Whatu Ora Chair Dame Karen Poutasi for her service on the Board. “Dame Karen tendered her resignation as Chair and as a member of the Board today,” says Dr Reti. “I have asked her to ...1 week ago
- Roads of National Significance planning underwayThe NZ Transport Agency (NZTA) has signalled their proposed delivery approach for the Government’s 15 Roads of National Significance (RoNS), with the release of the State Highway Investment Proposal (SHIP) today, Transport Minister Simeon Brown says. “Boosting economic growth and productivity is a key part of the Government’s plan to ...1 week ago
- Navigating an unstable global environmentNew Zealand is renewing its connections with a world facing urgent challenges by pursuing an active, energetic foreign policy, Foreign Minister Winston Peters says. “Our country faces the most unstable global environment in decades,” Mr Peters says at the conclusion of two weeks of engagements in Egypt, Europe and the United States. “We cannot afford to sit back in splendid ...1 week ago
- NZ welcomes Australian Governor-GeneralPrime Minister Christopher Luxon has announced the Australian Governor-General, His Excellency General The Honourable David Hurley and his wife Her Excellency Mrs Linda Hurley, will make a State visit to New Zealand from Tuesday 16 April to Thursday 18 April. The visit reciprocates the State visit of former Governor-General Dame Patsy Reddy ...1 week ago
- Pseudoephedrine back on shelves for WinterAssociate Health Minister David Seymour has announced that Medsafe has approved 11 cold and flu medicines containing pseudoephedrine. Pharmaceutical suppliers have indicated they may be able to supply the first products in June. “This is much earlier than the original expectation of medicines being available by 2025. The Government recognised ...1 week ago
- NZ and the US: an ever closer partnershipNew Zealand and the United States have recommitted to their strategic partnership in Washington DC today, pledging to work ever more closely together in support of shared values and interests, Foreign Minister Winston Peters says. “The strategic environment that New Zealand and the United States face is considerably more ...1 week ago
- Joint US and NZ declarationApril 11, 2024 Joint Declaration by United States Secretary of State the Honorable Antony J. Blinken and New Zealand Minister of Foreign Affairs the Right Honourable Winston Peters We met today in Washington, D.C. to recommit to the historic partnership between our two countries and the principles that underpin it—rule ...1 week ago
- NZ and US to undertake further practical Pacific cooperationForeign Minister Winston Peters has announced further New Zealand cooperation with the United States in the Pacific Islands region through $16.4 million in funding for initiatives in digital connectivity and oceans and fisheries research. “New Zealand can achieve more in the Pacific if we work together more urgently and ...1 week ago
- ‘It could be the death of the museum’: why research cuts at a South Australian institution have ...
 Source: The Conversation (Au and NZ) – By Elizabeth Finkel, Vice-Chancellor’s Fellow, La Trobe University Sia Duff / South Australian Museum In February, the South Australian Museum “re-imagined” itself. In the face of rising costs and inadequate government funds, CEO David Gaimster, who took the reins last June, declared ...34 mins ago
 - Government signs off $41m clean energy deal with Asian Development Bank
 The government has committed $41 million to clean energy transition at the Asian Development Bank's Energy Transition Mechanism. ...48 mins ago
 - Are 2 mid-career AFL retirements a sign Australian athletes are taking brain health more seriously?Source: The Conversation (Au and NZ) – By Alan Pearce, Professor, School of Allied Heath, Human Services & Sport, La Trobe University, La Trobe University This week, Collingwood AFL player Nathan Murphy announced his retirement, brought on by his concussion history and ongoing issues. The 24-year-old’s seemingly sudden retirement, ...3 hours ago
- Luxon: Waitangi Tribunal comments from coalition parties 'ill considered'Comments from ACT and NZ First ministers about the Tribunal were "ill considered" and "that message will be underscored" to them, the PM says. ...3 hours ago
- Mental Health Foundation Facing Staff Cuts From Govt Funding Squeeze
 The Mental Health Foundation provides support and resources for those facing the loss of their job, so it’s wrong in the very week the Government adds another 1000 jobs to its tally of cuts, that this is happening. ...3 hours ago
 - I wholeheartedly recommend The President: a brilliant revival of a play of decay, terror and revulsi...Source: The Conversation (Au and NZ) – By Alexander Howard, Senior Lecturer, Discipline of English and Writing, University of Sydney Daniel Boud/Sydney Theatre Company Decay, terror, revulsion. These are three of the central themes of Thomas Bernhard’s rarely performed play The President. The Austrian is one of the greatest ...4 hours ago
- How the coolest little capital is shrinkingIt's not the first time a government has targeted public servants for job cuts, but this time Wellington is really feeling it. ...4 hours ago
- Ministers accused of Cabinet Manual breach with threats to Waitangi Tribunal
 Prime Minister Christopher Luxon says threats by ministers Shane Jones and David Seymour to reform or close down the Waitangi Tribunal were “ill-considered”, as legal experts say the ministers may have breached Cabinet Manual conventions. “I think those comments are ill-considered and we expect all ministers to actually exercise good ...4 hours ago
 - Many prisoners go years without touching a smartphone. It means they struggle to navigate life on th...Source: The Conversation (Au and NZ) – By Ye In (Jane) Hwang, Postdoctoral Research Associate at School of Population Health, UNSW Sydney Shutterstock You’d be hard pressed to find any aspect of daily life that doesn’t require some form of digital literacy. We need only to look back ten ...4 hours ago
- Good news: midlife health is about more than a waist measurement. Here’s whySource: The Conversation (Au and NZ) – By Rob Newton, Professor of Exercise Medicine, Edith Cowan University Pexels/RDNE stock project You’re not in your 20s or 30s anymore and you know regular health checks are important. So you go to your GP. During the appointment they measure your waist. ...4 hours ago
- The Friday Poem: ‘Mitochondrial Problem’ by Evangeline Riddiford Graham
 A new poem by Evangeline Riddiford Graham. Mitochondrial Problem I. It was long drive to Kansas for the man and his dog but you have to understand he said She doesn’t fly. Which calls to mind not carsick shitting barking or whining but a dog who chooses not to as ...4 hours ago
 - The Unity Books bestseller chart for the week ending April 18The only published and available best-selling indie book chart in New Zealand is the top 10 sales list recorded every week at Unity Books’ stores in High St, Auckland, and Willis St, Wellington. AUCKLAND 1 Hemingway’s Goblet by Dermot Ross (Mary Egan Publishing, $38) Hot off the press, this debut ...4 hours ago
- Department of Conservation closing Dunedin centre, but no jobs lostVisitor habits are changing and DOC needs to adapt in a financially sustainable way, its operations director says. ...4 hours ago
- Unions Collaborate With Thousands Of Job CutsWith New Zealand officially in recession, a swathe of mass sackings is currently sending shockwaves through the entire working class. ...4 hours ago
- Watch live: Christopher Luxon speaks to media in ManilaPrime Minister Christopher Luxon is speaking to reporters in Manila after pledging greater defence cooperation with the Philippines. Watch live. ...4 hours ago
- Government sent please explain letter to Wellington City Council over transport disagreementThe contents were revealed in correspondence from Simeon Brown and Chris Bishop to Wellington's Mayor. ...5 hours ago
- Some families push back against journalists who mine social media for photos – they have every rig...Source: The Conversation (Au and NZ) – By Laura Wajnryb McDonald, PhD candidate in Criminology, University of Sydney Less than 24 hours after Ashlee Good was murdered in Bondi Junction, her family released a statement requesting the media take down photographs they had reproduced of Ashlee and her family without ...5 hours ago
- Mental Health Foundation staff cuts loom, with funding falling behind rising costsChief executive Shaun Robinson said it has not had any government funding cut, but government-funded contracts have not kept pace with rising costs. ...5 hours ago
- The ‘devil comet’ 12P/Pons-Brooks has finally become visible from Australia. What can we expect?Source: The Conversation (Au and NZ) – By Jonti Horner, Professor (Astrophysics), University of Southern Queensland Pons–Brooks visible from Utah, March 9 2024. James Peirce/Flickr, CC BY-NC-ND If you’re a fan of all things space, you’ve doubtless heard about the “devil comet”, which has been captivating keen-eyed observers in the ...5 hours ago
- Rugby stadiums are sold as an economic asset – but NZ needs to ask if they’re really worth itSource: The Conversation (Au and NZ) – By Robert Hamlin, Senior Lecturer in Marketing , University of Otago A multi-billion dollar stadium precinct has been proposed for Auckland, one of three proposals in front of Auckland Council for a new stadium in the city. The council is also considering revamping ...5 hours ago
- Auckland dog attacks: Callouts for attacks on other animals going upRoaming dogs are responsible for more than a thousand attacks on animals each year, and the number is growing. ...6 hours ago
- What access to puberty blockers means for trans young people and their whānauThe Ministry of Health has delayed the release of its evidence brief on the safety, reversibility and mental health and wellbeing outcomes for puberty blockers. While we wait, Julia de Bres speaks to those with firsthand experience. Best practice gender-affirming healthcare is based on trans people’s self-determination and agency. The ...6 hours ago
- NZ and Philippines pledge defence cooperation amid rising tensionsThe commitment came after a sit-down meeting between Christopher Luxon and President Ferdinand "Bongbong" Romualdez Marcos Jr overnight. ...7 hours ago
- How superblocks can help reimagine city lifeBarcelona’s city streets have gone from traffic-clogged to pedestrian-friendly. How? Superblocks. Ellen Rykers explains. This is an excerpt from our weekly environmental newsletter Future Proof. Sign up here. Last week I read a great interview with renowned urbanist Janette Sadik-Khan by The Spinoff’s Wellington editor Joel MacManus: “You can reimagine streets, ...7 hours ago
- Fire engineering expertise may take a big hit with job cuts at MBIEThe public sector cuts are poised to take out a big chunk of expertise at the country's building regulator. ...8 hours ago
- “Fast-track Law To Kill Kiwi”: Students Say Fight Against Anti-democracy Legislation Is Only Jus...Student groups ‘Climate Action VUW’, Schools Strike 4 Climate and VUWSA will be on the street in Wellington today, the last day for submissions on the Fast-track Approvals Bill, with a message that the fight against the Government’s ‘War on ...9 hours ago
- ‘We have thousands of Modis’: the secret behind the BJP’s enduring success in IndiaSource: The Conversation (Au and NZ) – By Sofia Ammassari, Research Fellow, Griffith University Since 2014, Indian Prime Minister Narendra Modi’s popularity has grown exponentially – and so has the formidable organisational machine of his Bharatiya Janata Party (BJP). These two factors will be key to delivering the BJP a ...9 hours ago
- Online schooling is not just for lockdowns. Could it work for your child?Source: The Conversation (Au and NZ) – By Brendon Hyndman, Associate Professor of Education (Adjunct) & Senior Manager (BCE), Charles Sturt University During COVID almost all Australian students and their families experienced online learning. But while schools have long since gone back to in-person teaching, online learning has not gone ...9 hours ago
- Hear me out: You can shove your reusable period productsYes, they’re better for the environment. No, that’s not a good enough reason for me to use them. Once every 26 days or so, my period arrives, and if struck by an act of God, I am caught red-crotched without products. How, after 17 years of this, do I still ...9 hours ago
- Rip It Up And Start Over – Fast-Track Approvals Bill Needs To Be Scrapped“It will cause significant harm to our environment and communities. It is completely at odds with New Zealanders’ relationship with nature and our need for a low-carbon, sustainable economic future." ...9 hours ago
- Maori Authority Warns Government On Fast Track LegislationThe Chair of the National Maori Authority, Matthew Tukaki, has warned a Parliamentary Select Committee that fast-tracking legislation is a perilous practice that undermines the core tenets of democracy, transparency, and accountability. ...9 hours ago
- Why the government’s haste in changing the health system could come back to haunt itSource: The Conversation (Au and NZ) – By Tim Tenbensel, Associate Professor, Health Policy, University of Auckland, Waipapa Taumata Rau Getty Images Since coming into power, the coalition government has adopted a simple but shrewd see-how-fast-we-can-move political strategy. However, in the health sector this need for speed entails ...9 hours ago
- Many suicides are related to gambling. How can we tackle this problem?Source: The Conversation (Au and NZ) – By Anastasia Hronis, Clinical Psychologist, University of Technology Sydney Darya Sannikova/Pexels Whether you’re watching TV, attending a footy game, or eating a meal at your local pub, gambling is hard to escape. Although the rise of gambling is not unique to Australia, ...9 hours ago
- Things that go buzz in the night – our global study found there really are more insects out after ...Source: The Conversation (Au and NZ) – By Mark Wong, Forrest Fellow, School of Biological Sciences, The University of Western Australia Have you ever wondered if there are more insects out at night than during the day? We set out to answer this question by combing through the scientific ...9 hours ago
- Why don’t Australians talk about their salaries? Pay transparency and fairness go hand-in-handSource: The Conversation (Au and NZ) – By Carol T Kulik, Research Professor, University of South Australia IR Stone/Shutterstock In Australia, it’s not the done thing to know – let alone ask – what our colleagues are paid. Yet, it’s easy to see how pay transparency can make pay ...9 hours ago
- ‘Character’ And Its Impact On Immigration StatusThe Ministry of Business, Innovation and Employment (MBIE) is sounding a warning to migrants, that running foul of the law may see them leaving the country prematurely. ...9 hours ago
- 20,000 more on jobseeker benefits than this time last yearThe government’s plan to get 50,000 people off jobseeker support by 2030 has had a rocky start, writes Catherine McGregor in this excerpt from The Bulletin, The Spinoff’s morning news round-up. To receive The Bulletin in full each weekday, sign up here. Beneficiary numbers are up – and so are ...11 hours ago
- All of the Raglan Roast cafes in Wellington, ranked from worst to bestRaglan Roast is a staple of Wellington coffee culture. But with five branches across the capital, which one is the best? I am a die-hard Raglan Roast fan. It’s consistently the most affordable cafe in Wellington, and one of the only places you can get a coffee after 3pm. So, ...13 hours ago
- Auckland uni students threaten rent strike over rising accommodation feesResidents of University of Auckland halls are being urged to withhold their accommodation fees from May 1, in a bid to force the university to take student concerns over rent hikes seriously. The University of Auckland is facing a strike from students over the cost of on-campus accommodation. The Students ...13 hours ago
- Warning of death from a million cuts as Oceans Secretariat dissolvedShane Jones says people voted for change, but opponents say small cuts such as ending a special oceans secretariat are starting to add up The post Warning of death from a million cuts as Oceans Secretariat dissolved appeared first on Newsroom. ...13 hours ago
- Defence deal to counter Beijing’s aggression in South China SeaNew Zealand and the Philippines have signed a new maritime security agreement and stated their concerns over activity in the South China Sea, as Chinese vessels continue to flout international law. Prime Minister Christopher Luxon and Philippines President Ferdinand “Bongbong” Marcos committed to signing a Mutual Logistics Supporting Arrangement by ...13 hours ago
- Wellington’s ebb and flow of public servantsThe thousands of government “back-office” job cuts are causing widespread pain in the capital city. In today’s episode of The Detail, we speak to three journalists and a think tank researcher, looking at the larger picture around the cuts and what effect it will have on Wellington, a city that’s ...13 hours ago
- New Zealand transport planning has gone off the railsOpinion: The famed American architect and urban designer Daniel Burnham once said, “Make no little plans. They have no magic to stir men’s blood!” Burnham wouldn’t have been referring to the transport plans in Aotearoa New Zealand over the past five years; projects so big they hadn’t the credibility to ...13 hours ago
- Daily crossword, Friday 19 AprilThe post Daily crossword, Friday 19 April appeared first on Newsroom. ...13 hours ago
- Brakes on transport and logistics sector as demand for freight slowsThe transport sector is currently in the slow lane The post Brakes on transport and logistics sector as demand for freight slows appeared first on Newsroom. ...13 hours ago
- Newsroom daily quiz, Friday 19 AprilLoading…(function(i,s,o,g,r,a,m){var ql=document.querySelectorAll('A[quiz],DIV[quiz],A[data-quiz],DIV[data-quiz]'); if(ql){if(ql.length){for(var k=0;k<ql.length;k++){ql[k].id='quiz-embed-'+k;ql[k].href="javascript:var i=document.getElementById('quiz-embed-"+k+"');try{qz.startQuiz(i)}catch(e){i.start=1;i.style.cursor='wait';i.style.opacity='0.5'};void(0);"}}};i['QP']=r;i[r]=i[r]||function(){(i[r].q=i[r].q||[]).push(arguments)},i[r].l=1*new Date();a=s.createElement(o),m=s.getElementsByTagName(o)[0];a.async=1;a.src=g;m.parentNode.insertBefore(a,m)})(window,document,'script','https://take.quiz-maker.com/3012/CDN/quiz-embed-v1.js','qp'); Got a good quiz question? Send Newsroom your questions. The post Newsroom daily quiz, Friday 19 April appeared first on Newsroom. ...13 hours ago
- Financial literacy should be on all of usOpinion: With maths understanding at 42 percent for Year 8 students, there’s no doubt something has to be done. But how? The post Financial literacy should be on all of us appeared first on Newsroom. ...13 hours ago
- Missy rustles to stardom in CanadaHineaupounamu ‘Missy’ Nuku has been scaling mountains in Canada for her college basketball team, the Lakeland Rustlers. Alberta is currently home for the 20-year-old point guard, who is in her first year of a scholarship at Lakeland College, where she is studying for a business degree. She has certainly made ...13 hours ago
- Emissions fall again – now NZ needs to up the paceOfficial figures confirm New Zealand produced less climate pollution in 2022 than in any other year in the 21st century The post Emissions fall again – now NZ needs to up the pace appeared first on Newsroom. ...13 hours ago
- Grattan on Friday: Ethnic tensions will complicate the Albanese government’s multicultural policy ...Source: The Conversation (Au and NZ) – By Michelle Grattan, Professorial Fellow, University of Canberra When ASIO boss Mike Burgess delivered his annual threat assessment earlier this year, he stressed the rising danger posed by espionage and foreign interference. “In 2024, threats to our way of life have surpassed ...19 hours ago
- Group plans work to improve safety of female MPsNew research shows harassment of elected officials - especially women - is on the rise. ...20 hours ago
- Ukraine warns of WW3 ahead of long-stalled Congress aid voteUkraine's Prime Minister says his country desperately needs the US to approve long-stalled security assistance. ...21 hours ago
- PSA astonished Education Minister expects hiring of contractors to review curriculumHiring contractors is an appalling solution when people who could do the work are losing their jobs, the PSA says. ...22 hours ago
- Crown lawyers attempt to block Waitangi Tribunal summons to Minister for ChildrenThe Tribunal had called on Minister for Children Karen Chhour to provide evidence at an urgent inquiry into the repeal of Section 7AA of the Oranga Tamariki Act. ...23 hours ago
- Luxon refuses to guarantee public consultation on AUKUS Pillar 2Prime Minister Christopher Luxon says it's "far too premature" to be confirming whether the public would be consulted on joining AUKUS Pillar 2. ...1 day ago
- Visualising the 1800s or designing wedding invitations: 6 ways you can use AI beyond generating textSource: The Conversation (Au and NZ) – By T.J. Thomson, Senior Lecturer in Visual Communication & Digital Media, RMIT University Midjourney image by T.J. Thomson As more than half of Australian office workers report using generative artificial intelligence (AI) for work, we’re starting to see this technology affect every ...1 day ago
- Falls, fractures and self-harm: 4 charts on how kids’ injury risk changes over time and differs fo...Source: The Conversation (Au and NZ) – By Lisa Nicole Sharwood, Injury epidemiologist | Expert Witness, UNSW Sydney Sergey Novikov/Shutterstock Injuries are the leading cause of disability and death among Australian children and adolescents. At least a quarter of all emergency department presentations during childhood are injury-related. Injuries can ...1 day ago
- Choice and control: will NDIS reforms mean people with disability don’t get to decide who they liv...Source: The Conversation (Au and NZ) – By Di Winkler, Adjunct Associate Professor, Living with Disability Research Centre, La Trobe University Shutterstock/Ground Picture Many Australians with disability feel on the edge of a precipice right now. Recommendations from the disability royal commission and the NDIS review were released late ...1 day ago
- Asbestos in playground mulch: how to avoid a repeat of this circular economy scandalSource: The Conversation (Au and NZ) – By Salman Shooshtarian, Senior Lecturer, School of Property, Construction and Project Management, RMIT University Salman Shooshtarian Asbestos has been found in mulch used for playgrounds, schools, parks and gardens across Sydney and Melbourne. Local communities naturally fear for the health of their ...1 day ago
- Could Albanese’s bet on homegrown green industries be the boost our regions deserve?Source: The Conversation (Au and NZ) – By Madeline Taylor, Senior Lecturer, Macquarie University Cloudy Designs/Shutterstock Right now, there’s a global race underway. The goal: bring back manufacturing and energy jobs as the energy transition speeds up. In 2022, America launched its mammoth Inflation Reduction Act and the ...1 day ago
- Watch: Prime Minister Christopher Luxon won't say if government will consult public on joining ...Asked multiple times if the public will be consulted on joining the defence pact, Luxon repeatedly said that was yet to be worked through. ...1 day ago
- Watch live: Prime Minister Christopher Luxon speaks in PhilippinesPrime Minister Christopher Luxon is speaking to reporters on the third leg of his Southeast Asia trip, from Manila in the Philippines. ...1 day ago
- Māori lawyers call Shane Jones' Waitangi Tribunal comments 'inappropriate'The Māori Law Society says his comments breach the principle of the separation of powers and the Cabinet Manual. ...1 day ago
- Abortions Increase 25% Since Law ChangeFamily First says that the latest abortion statistics make grim and upsetting reading, with a 25% increase in abortions since the decriminalisation of abortion in March 2020. According to an Official Information Act request received by Right to Life ...1 day ago
- Over Half Of New Zealanders Feel That The Country Is In Decline And That Our Society Is BrokenIpsos New Zealand's inaugural participation in a global study on populism reveals a pervasive sense of societal and economic decline among New Zealanders. MORE DETAILS AND FULL REPORT HERE Ipsos New Zealand's inaugural participation in a global study ...1 day ago
- Australia’s new defence strategy is big on ideas, but lacks one key ingredient: well-trained soldi...Source: The Conversation (Au and NZ) – By Peter Layton, Visiting Fellow, Strategic Studies, Griffith University There have been a lot of defence announcements recently about buying new equipment, building up Australia’s manufacturing capabilities, creating local jobs, new legislation to support AUKUS and even a new defence chief. In ...1 day ago
- What does Steve Smith’s Stateside signing mean for cricket in the US – and Australia?Source: The Conversation (Au and NZ) – By Tim Harcourt, Industry Professor and Chief Economist, University of Technology Sydney Steve Smith, one of this generation’s finest batters, has conquered much of the cricketing world during his career, and he now has set his sights on a new frontier: the United ...1 day ago
- A love letter to Wellington: when i open the shop by romesh dissanayake, reviewedMadeleine Ballard reviews the debut novel from romesh dissanayake. when I open the shop, the debut novel by Naarm-based Aotearoa writer romesh dissanayake (Sri Lankan, Koryo Saram), is a narrative of grief. Devendra loses his mother, opens a noodle shop on The Terrace, grieves, and emerges changed. But just as ...1 day ago
- Minister Concedes Contractors Will Be Hired To Do Work Of Axed Ministry Of Education StaffThe PSA can’t believe that the Minister of Education is happy for her ministry to hire contractors at the same time it is dismissing 565 workers. ...1 day ago
- Attempt to bar diplomat from Myanmar military junta failsMyanmar community members applied to the courts to bar the diplomat from attending the Association of Southeast Asian Nations. ...1 day ago
- LGNZ Welcomes Govt Earthquake-prone Buildings DecisionLGNZ has advocated for this decision as part of a remit led by Manawatū District Council. ...1 day ago
- AUKUS Pillar 2 a 'fragrant, methane-wrapped bull***' – Bob CarrThe former Australian Foreign Minister has continued to warn New Zealand against joining the defence pact. ...1 day ago
- Enforceable undertaking issued to abc accounting services limited after continued non-compliance.The Department of Internal Affairs (DIA) has accepted an enforceable undertaking agreement from ABC Accounting Services Limited (ABC) under section 81 of the Anti-Money Laundering and Countering Financing of Terrorism Act 2009 (AML/CFT Act). ...1 day ago
- REVEALED: RNZ’s Hypocrisy Over Fair Digital News Bargaining BillThe Taxpayers’ Union can reveal that Radio New Zealand (RNZ) spent $71,842.53 on Facebook advertising over the past 12 months, despite earlier this year coming out in support of the Fair Digital News Bargaining Bill , which would force the likes ...1 day ago
- Police rejected 'very good offer' – Mark MitchellPolice Minister Mark Mitchell says the pay offer rejected by police was the best the government could put forward under difficult financial circumstances. ...1 day ago
(*Burt) “Equally you could say that warmer weather causes slower economic growth, since most countries situated close to the equator are relatively poor”.
No Burt – there’s no way of tieing those together, and there haven’t been hundreds of neuanced studies on the topic that have been compared with each other to reach robust conclusions…
Does that save us from Burt?
*”Burt” is being used here only as a random name and in no way refers to a person and/or personality thaat comments regularly at The Standard.
The first graph plots “average maths and reading scores” over income inequality.
This is clearly an instance where the correlation is around the wrong way. “Average maths and reading scores” could be considered a proxy for general IQ. General IQ is highly likely to predict income. For instance, in the link provided notice the high levels of poverty associated with low IQ. Those with IQ of 75 or less had by far the highest proportion living in poverty. It is also known that IQ is the best predictor of job performance. So people who are more intelligent are also likely to be more successful.
“General IQ is highly likely to predict income…..It is also known that IQ is the best predictor of job performance. So people who are more intelligent are also likely to be more successful.”
If I was to point out all the exceptions to that rule, you’d probably yell ‘anecdotal evidence’, tsmithfield. But really, your arguments are utter bollices…
Outlier alert. Graph 2. Complete nonsense.
Are you saying that the U.S. and the U.K. don’t count? That’d be weird.
Why do you think I said any such thing?
Here is what I said with respect to a graph from the previous article in the series:
All I am saying here is the analysis method is completely wrong for the data on this occasion.
It is almost as if the authors have tried the method I have recommended above, found no correlation so thought, “shit, we’d better use a method that does give a trend”. This is one of the things that concerns me a lot. And should concern you as well. The authors seem to choose their analysis methods on the basis of what will prove their thesis.
Another thing, why have they gone and cut out most of the countries on that graph (graph 2).
Did you get a substantially different result?
Clearly, if the same method was used as they had used in the graph I commended, there would be little or no trend at all. Besides the fact that there are far too few data points on that graph to use regression any way. You didn’t answer my question about why they excluded so many of the countries on that graph BTW. Compare that graph to the other graphs in this article for instance.
I can’t answer your question because I know nothing about it – stats aren’t my area at all. I’m just trying to learn a bit more about where you’re coming from.
Can’t blame you. Stats is the sort of area that if you haven’t been using it for awhile, its easy to forget. 🙂 So I don’t proclaim to be an expert at all.
However, a simple way to see the problem is to compare a mean (average) with a median (middle) score.
Consider the following series:
15, 19, 22, 23, 24, 26, 160.
Here, the score “160” could be considered an outlier.
The average (mean) for the series above is 41.28. The median (middle score) is 23. Measures of central tendency should be quite similar in value in normally distributed data. But here you can see that the single score “160” is considerably inflating the average score above the median score, giving a result that is clearly out of line with the rest of the series.
I would conduct this sort of analysis as a very basic test before determining how to treat the data in more complex analysis.
In this sort of situation, one would normally either trim off the outlier if using a “mean” (average) based method of analysis such as least squares regression that appears to have been used on the graph. Or use a method of analysis that is not based on the “mean” (average) to determine the trend so that it is not unduly affected by the outlier.
The problem I have with a lot of the “spirit level” stuff is that they seem to have chosen the method to suit what they want to find. For instance, there are some charts, as I pointed out the other day, where there is clearly a nice trend in the main body of data points, so they appear to have been happy to use a method that excludes the effect of obvious outliers. However, where there is no clear trend in the main body of data, they seem happy to use a method that is highly affected by that outlier.
In graph 2 of this series, see what sort of trend line you would get if you covered up the UK and US. That is not to say these data points are unimportant. Just that the analysis method is wrong.
I hope that helps.
Outliers should not always be rejected:
http://cnx.org/content/m17094/latest/
What look like outliers may actually be ‘influential points’ which can actually improve the reliability of the correlation.
http://stattrek.com/AP-Statistics-1/Residual.aspx?Tutorial=Stat
Fair point. And I am aware of the need to study outliers.
However, consider the point I have made below. I would rather show a weaker trend not relying on an outlier than include it and leave the door open to the critiicism. I like to understate rather than overstate data in a study. This makes the case much more convincing.
If the trend is reliable it should be present regardless of outliers. In a number of the graphs I have seen from “the spirit level” the trend is entirely dependent on the inclusion of the outliers. Therefore, I still hold that it has not been justifiable to include the outliers, even on the basis of the point you have just made.
In the case above, the authors would need to provide considerable justification as to why the outlier was included. That starts getting into the realm of the subjective. What some consider as important, others might not.
Also, the inconsistency of how they have apparently used different analysis methods depending on whether a trend was obvious or not is something that is quite concerning.
You didn’t answer my question about why they excluded so many of the countries on that graph BTW.
Unfortunately my father still has my copy so I can’t answer directly but it’s probably for the simple reason that usable data on ‘social mobility’ may only be available for those countries.
Sure it would be nice to have perfect data for everything, but we don’t. That doesn’t mean we cannot make reasonable inferences from incomplete, imperfect information. Makes the job more interesting and fun.
Hi TS, to quote the authors:
“Comparable international data on inter-generational social mobility are available for only a few or our rich countries [i.e., those developed countries chosen for clear reasons expounded by the authors in their book and on the Equality Trust website]. We take our figures from a study by economist Jo Blanden and colleagues at the London School of Economics. Using large, representative longitudinal studies for eight countries, these researchers were able to calculate social mobility as the correlation between fathers’ incomes when their sons were born and sons’ incomes at age thirty. Despite having data for only eight countries, the relationship between inter-generational social mobility and income inequality is very strong.” (p. 159)
So, in answer to your question: There’s only eight countries because there’s no data for others. Also, the relationship was found by economists from the LSE. While it’s no guarantee, you’d expect economists from the LSE would get basic stats right in a publication from the Centre for Economic Performance at the LSE – wouldn’t you?
I don’t know, Puddlegum. I’ve seen some pretty bad stuff in published “peer reviewed” articles from time to time. See my reply to Felix above.
Hat Tip Hot Topic
TS, here’s a 2009 update from Joanne Blanden on what is now known about intergenerational mobility in international comparisons.
You’ll note, in the Conclusions section, confirmation of the general inverse relationship between inequality and mobility but also the interesting difference in different mobility measures for Germany and the US. In the US income mobility is very low but there’s some mobility in terms of education and social class between generations. The reverse in Germany.
At a glance, her statistical proficiency looks ok to me.
Thanks Puddlegum.
I am not trying to argue if the construct is valid or not. It is the methods used in analysis that I have a problem with.
In the case of graph 2, rather than try and find trends in the data points, a more interesting question to me would have been why the UK and US are so different than the other countries. That might have led to a similar conclusion. However, it would have been a much more valid way of getting there.
Fair enough.
Pearson’s r is affected by outliers. So let’s follow what you suggest and ignore the fact that the correlation for the eight countries is strong (r=0.93, p<0.01).
The funny thing is, if most people were asked what was different about the US and UK (compared with the other countries included) they'd probably say more economic freedom, neo-liberalism, etc.. Yet, oddly, they are the lowest on mobility, so that kind of ‘freedom’ doesn’t seem to generate mobility. Mobility here is measured by ‘father-son’ incomes, not educational attainment or social status.
I’d add in defence of W&P that if you read pages 159-160 in their book you’ll find that they are deliberately cautious and they only include it because of a range of other observations in the literature (e.g., on social mobility changes over time within the US and other countries, spending on education, etc., etc.) which they then go on to detail. They note that it is those additional observations that “lend plausibility to the picture we see in Figure 12.1”.
They’re not trying to pull the wool over anyone’s eyes, TS – it’s clear when you read the book.
Puddlegum, the reason the correlation is strong is due to the inclusion of the outliers. So I wouldn’t read too much into those figures. Given there are only eight data points, a very steep slope is about the only way a low p value could be achieved.
I accept they have qualified their inclusion of the graph. However, I think there are much better ways they could have analysed the data to make their point. What they have done in presenting the data is really quite meaningless.
Maybe But given we are talking about two countries out of many, there could be other significant differences as well that could account for the affect. We simply don’t know. Since there is a reliance on data from only eight countries, I simply don’t think there was enough data to make any conclusion.
What they could have done was simply summarized the previous research they cite to make their point rather than try and display data in a way that is really quite shabby.
I think you’re getting a bit contradictory. You say “there are much better ways they could have analysed the data to make their point” and then say “Since there is a reliance on data from only eight countries, I simply don’t think there was enough data to make any conclusion”.
Either their analysis and display of data was ‘shabby’ but could have been done better through alternative analyses or there’s nothing in the data. Which is it?
What they did was show an analysis that was ambiguous and open to interpretation but could be supported by additional observations (data). In that context, the analysis was not ‘shabby’ but, rather, was consistent with what else is known about mobility and inequality. That is, it represents another brick in quite a big evidential wall.
Remember that, while the correlation is not robust, that doesn’t make it wrong. Scientists are detectives and they piece together the evidence in ways that seem to make sense of as many data as possible.
W&P are not concluding anything from the graph in and of itself – that’s why they discuss other evidence that makes that apparent correlation seem more plausible. It’s just not true to say it’s ‘shabby’ of them to present the regression lines, given that they acknowledge its limitations and provide further evidence to suggest it may well show something real.
Quite genuinely, this is how science progresses, for better or worse.
The other thing is that I very much doubt that with only 8 data points they would be able to satisfy the underlying assumptions of normally distributed data that is required for reliable use of regression techniques.
I accept that this is not all they were relying on. However, I think I still have a valid point in that including the graph weakens their argument rather than strengthens it. And I have seen a number of other examples where they have done the same thing. So its not an isolated case. All it achieves is to attract criticism toward what might otherwise be a very good study. I actually like statistical analysis, and my eyes tend to roll back into my head when I see this sort of thing. Then I tend to feel quite skeptical about anything else they say.
What would be better would be time-series data from one country (say the US) correlated against changes in income equality over that time-frame.
Further to my comments above, the general criticism I have of “the spirit level” is as follows:
Sometimes its what is left out that strengthens an argument. If I were doing this “spirit level” study and felt I had a really strong argument, I would cut out anything that was the slightest bit dodgy and just leave in the really strong stuff.
In this case, I would have definitely excluded graph 2. The reason is that only having data for eight countries out of the 50 odd they decided to include in their study is simply too few to be convincing. We don’t know what the trend would have looked like had their been a heap more data points, so that graph isn’t at all convincing, without even thinking about whether their analysis method is appropriate or not.
The way they have done it has left it open for people such as myself to find fault with what they have done. When I see what appears to be quite a naive approach to data analysis, it makes me feel quite dubious about the study as a whole. If they had focused on the strong stuff I would have been more impressed.
See my comment just above. There’s a bit more known now.
See my reply to your last post.
Ditto (I’m just trying to be the 200,000th commenter!)
Um – just because there are weaker points beside stronger arguments does not mean that the stronger arguments are invalid. Particularly if the topic is a larger picture that covers many different areas and aspects.
I can’t figure out your purpose, TS. Are you suggesting that because one graph in the post might have issues, then the bigger claim that inequality is associated with a number of other negatives is therefore in doubt? Are you going to put similar effort into all the other graphs?
Or do you agree with the gist of the Spirit Level as summarised in the post, but just like getting anal about statistics in lieu of an actual point?
“Um – just because there are weaker points beside stronger arguments does not mean that the stronger arguments are invalid. Particularly if the topic is a larger picture that covers many different areas and aspects.”
True enough. However, the weaker points can tend to obfuscate the stronger ones; or undermine the stronger points if fallacious ones are included. So why keep them in?
“I can’t figure out your purpose, TS. Are you suggesting that because one graph in the post might have issues, then the bigger claim that inequality is associated with a number of other negatives is therefore in doubt? Are you going to put similar effort into all the other graphs?”
Except its not just one graph. As I pointed out above, the authors are prone to doing this sort of thing. There are a number of issues I have about the way the authors appear to have done things.
“Or do you agree with the gist of the Spirit Level as summarised in the post, but just like getting anal about statistics in lieu of an actual point?”
To be fair, I haven’t actually read the book itself. Hence, it is unreasonable for me to be drawing firm conclusions about the book itself. That is why discussions with the likes of Puddlegum is quite interesting; in that he has read the book and appears to have a good knowledge of scientific method etc.
I have read a lot of scientific reports in the past based on statistics, and they are very careful about methods they use, justification for those methods etc. Because I have some knowledge in statistics, I am also very aware of how statistics can be misused. So, although it may seem a bit “anal” I like to think I do have a point. 🙂
However, the weaker points can tend to obfuscate the stronger ones; or undermine the stronger points if fallacious ones are included. So why keep them in?
ummm… because if they were left out folks like you would have accused them of ‘cherry picking’?
TS, to date you have written probably as much on this book as the original authors.As such you probably have a body of work that you might publish in the best spirit of free and open market competition with the original authors. Why dont you do this, really, no kidding. Then we can do two things: one see how many you sell by comparison which in itself might be instructive, and two have it put up on webs sites like this so that you can watch incessant critiques by bloggers of your nature. Have fun.
Bored, you have just committed a sort of backward logical error of appeal to authority. I would encourage you not to be blinded by ideology but to actually be able to step back and assess the quality of the work in question.
Sure, I haven’t published papers or the like. However, I have done some papers on critical data analysis, analysis methods etc. Also, I have used reasonably complicated analysis techniques such as structural equation modelling in my thesis. So, I know enough to be able to criticise this sort of stuff. Notice above that even Puddlegum and the authors themselves concede that the graph I have been criticising in itself is very weak evidence for their argument. So, I am not just blowing hot air.
If I was going to do a study similar to “the spirit level” I wouldn’t bother with all these regression charts. If you have ever used a technique called “multiple regression” you will realise why.
The way I would have done the study would have been to start with a time-series study in one country, such as the US. I would then study the effect of changes in the data for income inequality with subsequent changes in social variables over a thirty year period or such. Doesn’t mean I would have to wait 30 years. Just that I would use historical data. My thesis would be that changes in income inequality would be associated with subsequent changes in social variables. I could then model for goodness of fit to confirm the direction of causation. Demonstrating that the theorised effect occurred after the theorised cause is a good way to rule out “correlation is not causation” arguments.
If that study demonstrated a significant association, I would then test other countries to see if the effect was repeatable in other cultures. If it repeats reliably then the argument would be very strong.
This would provide much more convincing results than what I have seen in the articles to date on “the spirit level”.
So you dont want to write a book BUT you are prepared to write the first chapter in reply to the idea……my goodness you could earn some cash if your prodigious output was saleable. And theres the rub.
What I have proposed as a better method is a very standard way of conducting these sorts of studies. Nothing weird or unusual about it. I am sure that if Puddlegum comes back on line he would agree.
Have you ever done any stat analysis in rhino hides?
No. Have you?
The way I would have done the study would have been to start with a time-series study in one country, such as the US. I would then study the effect of changes in the data for income inequality with subsequent changes in social variables over a thirty year period or such. Doesn’t mean I would have to wait 30 years. Just that I would use historical data.
The experiment had been done.
According to Naomi Klein, in her chapter from “The Shock Doctrine” called “Bonfire of a Young Democracy” (pp. 275-309), in 1989 there were about 2 million Russians living in poverty. Under corporatism (which the press mislabeled “democracy”), by the mid-90s, 74 million Russians lived in poverty. Along the way, addiction, alcoholism, violent crime, and AIDS skyrocketted, and longevity plummetted. Bottom line, the suffering in Russia was horrific, but was passed off in the media as the “growing pains” of the transition to “democracy,” when, in fact, it was an orgy of greed and abuse.
The result of Yeltsin throwing the nation’s assets into a vast fire sale was that around half of Russians finished up living in abject poverty, a much diminshed professional and middle class barely held their heads above water by working two or more jobs or cutting deals in various black markets…while a small elite prospered beyond all belief. The change in income inequality was extreme, and the consequences stark.
No fancy statistics needed.
Start with New Zealand.
Strong correlation between the rise in inequality and many indicators of social decline over the last 50 years, no matter what type of regression you use.
The time based study that TS wants to do confirm the ideas in the Spirit level ,especially over the last 30 years in the USA.
If you want an interesting comparison. Compare Illinois with North Dakota.