It isn’t that often that I agree with the anonymous editorials in the NZ Herald. But this morning’s editorial was completely accurate about Maurice Williamson’s reported comments after the census…
Pronouncements like, for example, that of Statistics Minister Maurice Williamson, who declared the first Census data in seven years contained a surprise “bigger than Ben Hur”.
The finding that so enraptured the minister was that New Zealand’s population growth had halved since the last Census. The population had increased by 31,000 a year, or 0.75 per cent, over the past seven years, compared to 58,000 a year in the previous 2001-2006 period. This, trumpeted Mr Williamson, should prompt a revision of Auckland’s infrastructure plans, such as an increase in high-rise apartments and the construction of an inner-city rail loop.
Ah yes. As the anonymous author at the NZ Herald pointed out, there are a few minor mathematical issues with Williamson’s “analysis”…
The growth rate is, indeed, surprisingly slow. But what that means for Auckland must be subject to a couple of important caveats. First, the data so far released – annoyingly, the Census findings are being drip-fed – does not reveal the extent of Auckland’s long-term growth.
This, as the Auckland Council’s chief planning officer, Roger Blakeley, noted, has historically been much more rapid than for other regions. This is not expected to change. Auckland has and will receive more migrants, and has a more youthful population than the rest of the country and, therefore, a higher fertility rate.A second proviso arises from the fact that the number of people leaving the country reached record highs during the past seven years. Already, this has started to decline as the Australian economy encounters headwinds. It is highly unlikely the emigration rate will continue to match that of the past seven years.
This doesn’t mean no notice should be taken of the Census data. The council’s planning for the next 30 years, as outlined in its Unitary Plan, is based on the prediction that the number of Auckland residents will grow by one million, or 2.2 per cent a year.
Leaving aside the second point – that National who campaigned in the 2008 election as being the party would stop many of our best and brightest disappearing. Obviously these days they’d prefer for forget that election promise, as instead they have presided amongst the fastest emigration in our history as people escaped the like of Williamson and Key’s inability to govern…. Yes – another post really needs to be written.
The first point is the important one. The trickle feed of stats doesn’t show regional differences yet. However you can see it in the maps for the electoral boundaries that are fed from the census. Since Maurice Williamson is an MP, you’d have expected that he’d have taken some interest in his own job’s geographical basis. But it appears that he hasn’t bothered to read the statistics NZ page about changes in voting populations in electorate since the last census. Now this isn’t the full populations (I only looked at the general roll and it excludes children and other non-eligible voters), but does give an idea of where the population is growing.
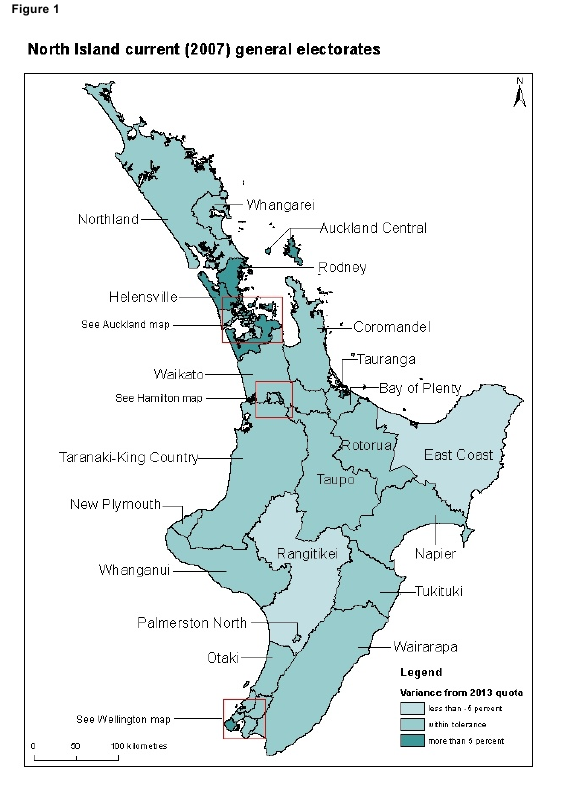
The following maps from the overview PDF show where the population increases have made geographical electorate seats overflow relative to the rest of NZ. There is a wee trend that perhaps even the hapless Mr Williamson may be able to detect. It is called Auckland is where most of the urban population growth is going to…
Bearing in mind that these electorate seats were roughly the same population size in 2007, it is pretty clear that almost all of the major urban growth has been in Auckland urban and semi-rural electorates and to a lesser extent in the dairy growth areas. If you look at the spreadsheet it becomes even more apparent – the second column is the percentage increase and I’ve tagged the type of electorate in the third.
In the top 10 growing electorates, Auckland has 7 of them. 3 are in the rural fringe of lifestyle blocks. 4 in the dominently urban areas. Auckland Central had a nearly 22% increase in voters in an already built up and congested zone.
| Hunua | 26.1 | Auckland |
| Selwyn | 23.8 | Rural |
| Auckland Central | 21.7 | Auckland |
| Rodney | 15.7 | Auckland |
| Hamilton East | 15.6 | Hamilton |
| Helensville | 14.1 | Auckland |
| Waimakariri | 12.1 | Rural |
| Waitakere | 11.6 | Auckland |
| East Coast Bays | 11.5 | Auckland |
| Papakura | 11.3 | Auckland |
| Bay of Plenty | 10.9 | Rural |
| Wellington Central | 9.5 | Wellington |
| Tauranga | 9.2 | Urban |
| Wigram | 9.0 | Christchurch |
| Manurewa | 8.8 | Auckland |
| Waikato | 8.7 | Rural |
| Te Atatū | 8.3 | Auckland |
| Waitaki | 8.0 | Rural |
| New Plymouth | 7.7 | Urban |
| Tāmaki | 7.7 | Auckland |
| Mana | 7.3 | |
| Ōhariu | 7.2 | |
| Māngere | 7.1 | |
| Nelson | 7.1 | |
| Maungakiekie | 7.1 | |
| Clutha-Southland | 6.9 | |
| Epsom | 6.6 | |
| Manukau East | 6.4 | |
| Rangitata | 6.2 | |
| New Lynn | 5.2 | |
| Botany | 5.2 | |
| North Shore | 4.9 | |
| Taupō | 4.9 | |
| West Coast-Tasman | 4.8 | |
| Northcote | 4.6 | |
| Kaikōura | 4.6 | |
| Pakuranga | 4.4 | |
| Mt Roskill | 4.3 | |
| Mt Albert | 4.3 | |
| Ōtaki | 4.1 | |
| Tukituki | 4.1 | |
| Rimutaka | 3.8 | |
| Whangarei | 3.5 | |
| Taranaki-King Country | 3.3 | |
| Rongotai | 3.1 | |
| Invercargill | 2.9 | |
| Hamilton West | 2.9 | |
| Napier | 2.5 | |
| Palmerston North | 2.5 | |
| Northland | 2.3 | |
| Wairarapa | 2.1 | |
| Dunedin South | 2.0 | |
| Coromandel | 1.7 | |
| Hutt South | 1.4 | |
| Rangitīkei | 0.5 | |
| Dunedin North | 0.1 | |
| Ilam | -0.5 | |
| Whanganui | -0.9 | |
| Rotorua | -1.4 | |
| East Coast | -2.0 | |
| Port Hills | -3.4 | |
| Christchurch Central | -7.2 | |
| Christchurch East | -17.6 |
Powered by WPtouch Mobile Suite for WordPress