Report shows incomes up, inequality down
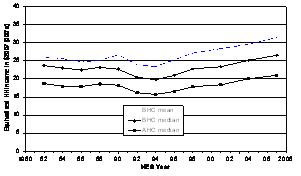
The MSD’s Incomes Report provides a wealth of information. For instance, here’s how the mean and median household incomes have moved since 1982.
Households suffered a massive erosion of income during the rightwing revolution from 1984 to the late 1990s. The leftwing governments since 1999 put that to a stop that. Now, incomes have regained and grown rapidly past those 1982 levels.
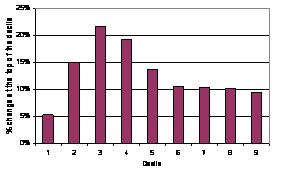
And during the period of increased incomes since 2001, most of the benefit has gone to middle and low income families. As you can see, it is the 4 lower-income deciles with the largest % increase in income (although the lowest decile, beneficiaries, has been left behind).
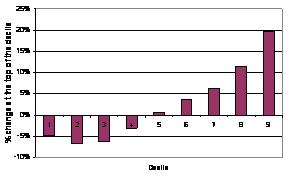
Compare that to what happened to incomes between 1988 and 2001. Under National, the poor really did get poorer and a few at the top got much richer, thanks to lower taxes on the rich, stagnant wages, and slashed benefits.
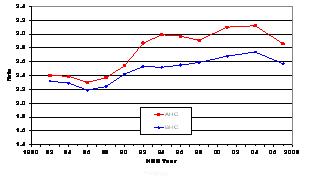
This graph shows how many times larger the 80th percentile income is than the 20th percentile. The higher the number – the wider the gap between rich and poor. (AHC and BHC are just two different ways of calculating the gap). As you can see the gap between rich and poor exploded during the rightwing revolution and it took some time before policies countering that took effect but we are now moving, slowly, back towards a more equitable situation.
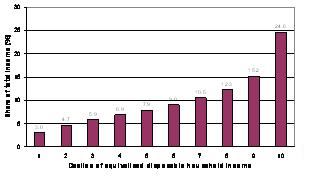
But, remember, it’s still far from equal, here is the portion of total national income, by income deciles. The top 10% have a combined income higher than the bottom 45% combined. Not exactly a socialist utopia.
(Full size graphs)