Flip (now at FlipNZ) has been continuing his investigations into a universal basic income (also UBI) by looking at the impacts on income and tax to see how we could use a UBI to create a greater income equality. He has allowed us to reprint the post
Income equality is one measure that can be used to indicate the equality of a society. I have analysed the 2011 income distribution and show how a UBI (Universal Basic Income) can create greater income equality. The details of the UBI and its benefits are detailed in other places. Quite a lot of discussion has occurred regarding the benefits and pro’s and con’s of it as well.
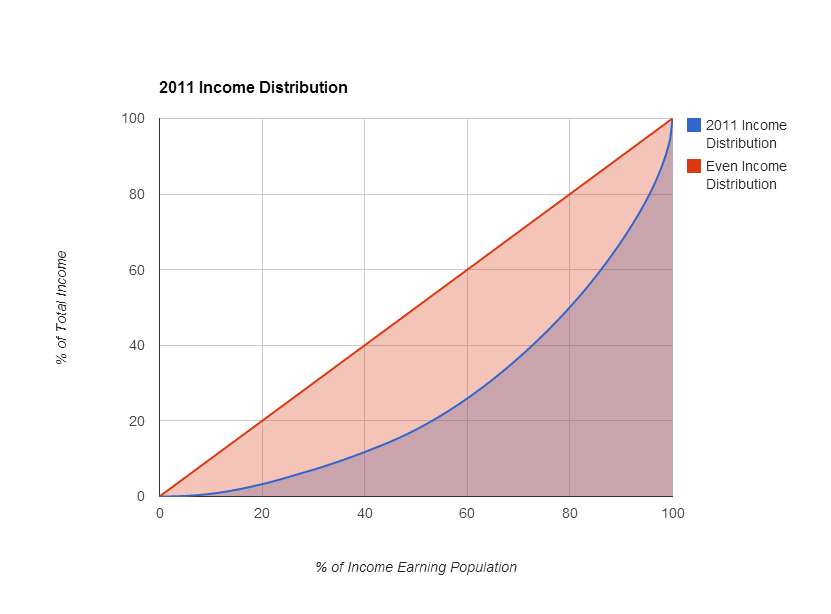
In the graph below the red line would be what the income distribution would be, when 50% of the income earning population received 50% of the income, 10% received 10% etc. In other words, if the income was evenly distributed among the population.
The blue line represents the actual NZ distribution of income in 2011.
The stepper the blue curve and the less area under the curve the more uneven the distribution of income. The closer it moves to the red line or the greater the area under the curve the more even the distribution of income. The steeper the curve the more income is earned by less of the population and less even the income distribution. By measuring the area under the blue line and subtracting it from the area under the red line you get a measure of inequality. (The area shaded in red). An index if you like.
Table of % of Population earning less than the income band per annum.
| % of Population | Approx Income Band |
| 20% | $11k |
| 40% | $19k |
| 50% | $25k |
| 60% | $34k |
| 80% | $54k |
| 95% | $93K |
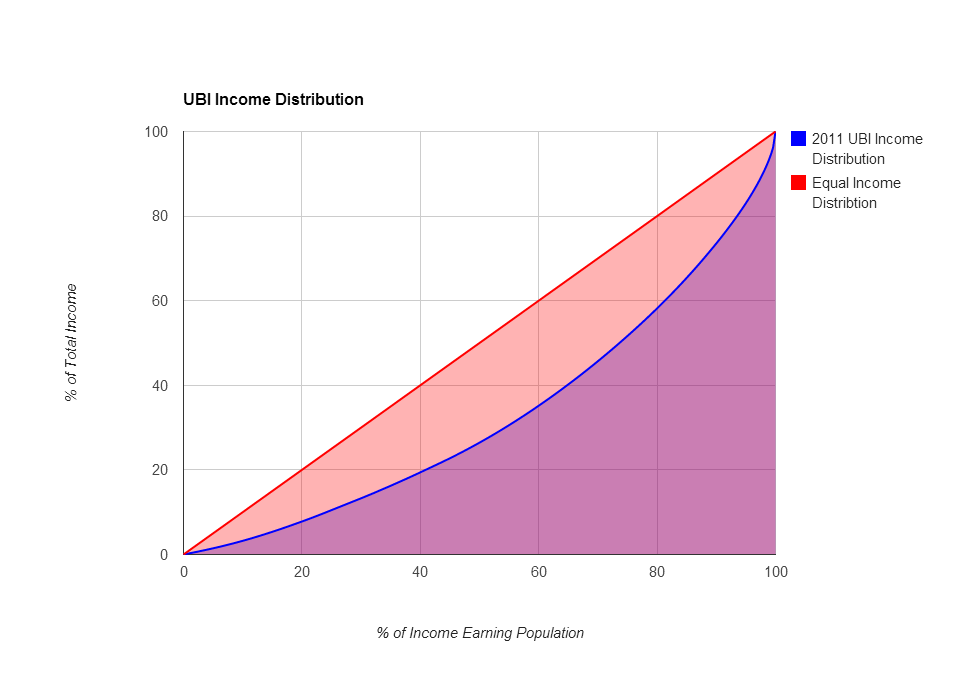
Applying a UBI of $9080 and a flat tax rate of 33% the curve looks like this. This has been selected based on analysis done by Perce Harpham and details can be found here. Alternatives schemes can be selected and various options are possible. This spreadsheet enables the experimenting with different levels of UBI and assumptions. Further comments are here.
The table below offers a comparison of other scenarios. The closer the Equality Index % is to 100% the more even the income distribution.
The 2007 scenario shows historically what the equality index was.
The 25K scenario is what would happen if the first $25K of income was tax free.
The UBI scenario gives people a UBI of $9,080 tax free and sets the tax rate at 33%.
The Flat scenario is what would happen if all income was charged at 33%.
Note the change in government tax income and the equality % change between the different scenarios.
The 25K and UBI scenarios alter the government funding so would need to recover that by other means assuming no loss of government service.
For the UBI an asset tax is proposed to fund it and savings would result from the simplified system. There would be less bureaucracy in the administration and management of benefits.
| Equality Index | Income ($m) | Tax ($m) | Tax take change from 2011 ($m) | UBI Cost ($m) | Government Income Change from 2011 | |
| 2007 | 52.37% | 106,085.50 | 25,192.10 | 1,039.60 | 1,039.60 | |
| 2011 | 53.00% | 121,153.40 | 24,152.50 | 0.00 | 0.00 | |
| 25K | 57.21% | 107,525.15 | 13,628.25 | (10,524.25) | (10,524.25) | |
| UBI | 64.69% | 112,441.12 | 39,980.62 | 15,828.12 | 31,268.34 | (15,440.22) |
| Flat | 53.00% | 81,172.78 | 39,980.62 | 15,828.12 | 15,828.12 |
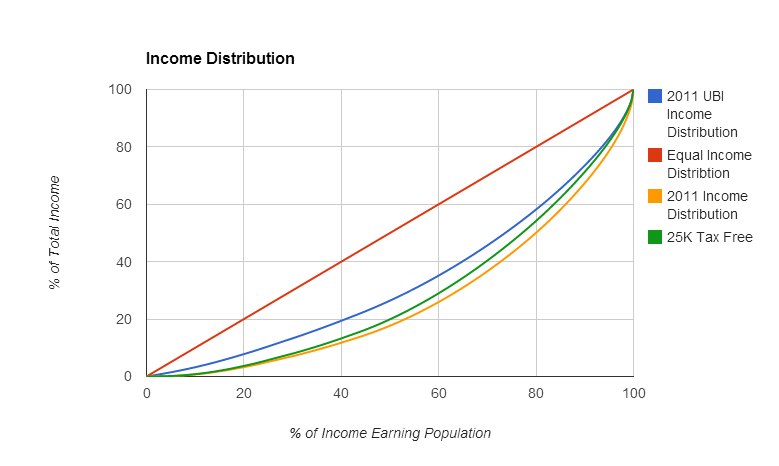
From the graph below it can be seen that the 25K tax free scenario reduces inequality a little and benefits middle to high income earners more than low income earners. The UBI has a much more significant effect spreading the benefits more evenly among the population.
For more details on the UBI scheme refer to this post.
Some actual real thought has gone into this UBI proposal. It is practical, simple and would actually work. It includes thoughts on the impact and how it would be paid for and actually removes complexity from the system unlike the fiddles by previous governments. I have not explained all the details but they can be found in the links. There are still some issues to resolve and it is impossible to assess all the impacts but nothing exists that amounts to a show stopper. The consequence of increasing the UBI is that it will increase the taxation level but the proposed amount is a start and can be sold politically and allows for further adjustments in the future once the benefits begin to accrue.
If a party sees inequality and its consequential social issues as a major issue and I think lots of people do, then here is something practical that can be done to address it with some real benefits and would improve the quality of life for most New Zealanders.
Powered by WPtouch Mobile Suite for WordPress