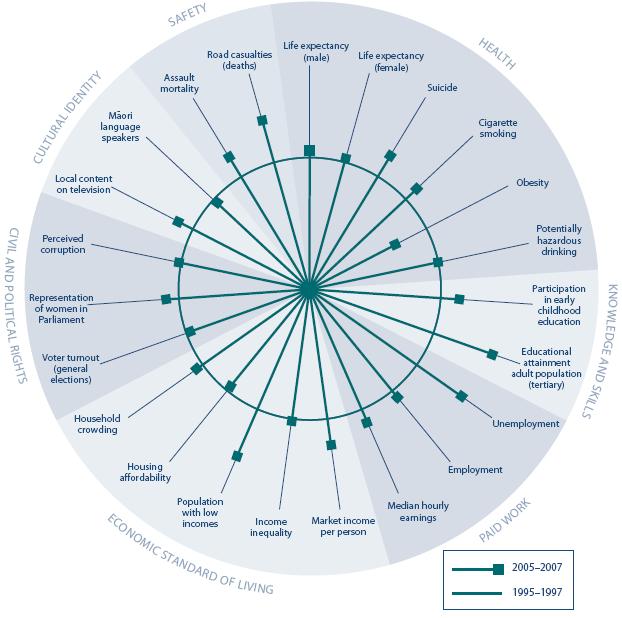
MSD released its Social Report today, an annual publication that collates a wide variety of standard of living measures, and produces this awesome graph. The circle represents the status quo in 1995-97 each spoke represents a different measure (income, crimes per capita etc). If the spoke is longer than the circle than the measure has improved between 1995-97 and 2005-07; if it is shorter that measure has become worse.
[large version, p138] Nearly every metric shows signficant improvement over living standards a decade ago (obesity is a notable exception).
As you can see the ‘Population with low incomes’ metric has improved dramatically. This metric measures the portion of households with ‘low incomes’ (defined as 60% of the median household income, after housing costs); essentially, it’s the poverty rate. In the mid-90s, 23% of households were in this situation; today the number is 12%. For the first time since the Social Report started in 2001, the figures show a reduction in income equality from a decade ago. The gap between rich and poor grew in the 1990s under National and has decreased under the Left-wing governments. Now, we have finally made up the ground lost under National.
There will be more posts once I’ve had time to read the report in detail. I recommend having a look; it’s an educating read. Nothing in it will stop the Kiwiblog Right claiming living standards in New Zealand are plummeting but then when did they ever let the facts get in the way of a good rant?
Powered by WPtouch Mobile Suite for WordPress