This post has been borrowed from the excellent site theoildrum.com, after originally being published on ourfiniteworld.com.
We all remember the oil price run-up (and run back down) of 2008. Now, with prices similar to where they were in the fall of 2007, the question quite naturally arises as to whether we are headed for another similar scenario.
Of course, we know that the scenario cannot really be the same. World economies are now much weaker than in late 2007. Several countries are having problems with debt, even with oil at its current price. If the oil price rises by $20 or $30 or $40 barrel, we can be pretty sure that those countries will be in much worse financial condition. And while governments have learned to deal with collapsing banks, citizens have a “been there, done that” attitude. They may not be as willing to bail out banks that seem to be contributing to the problems of the day.
If we look back at what happened three years ago, there was a huge run up in the price of oil, but very little change in oil supply.
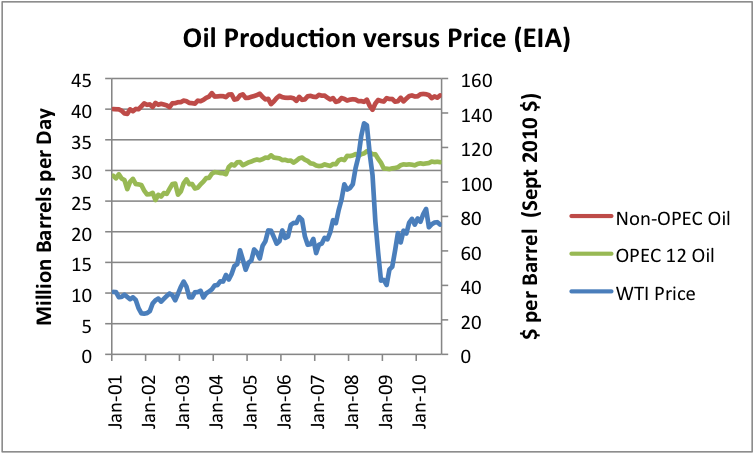
Figure 1. Production of oil (crude and condensate) for OPEC and Non-OPEC countries, compared to West Texas intermediate oil price, in September 2010$. Based on EIA data.
Oil price roughly corresponded to today’s price in October 2007. Between then and July 2008 (the peak in both prices and production), OPEC increased its oil supply by 1.3 million barrels. Non-OPEC actually decreased its supply by about 0.3 million barrels a day between October 2007 and July 2008, providing a net increase in oil supply of only about 1 million barrels a day, despite the huge run-up in prices.
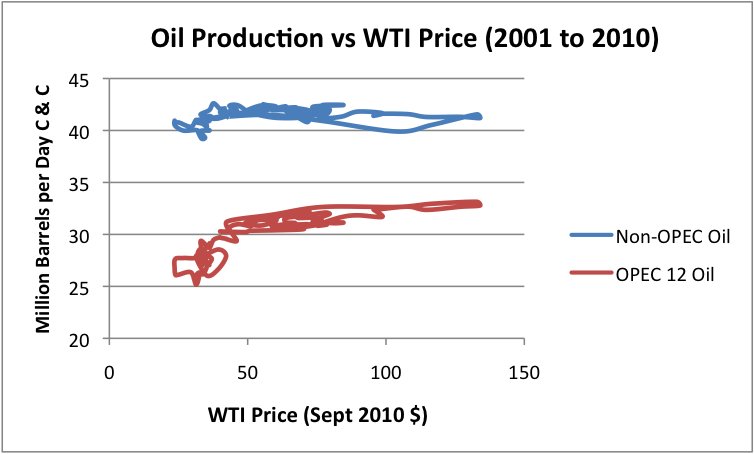
It can be seen from the above graph that the supply of OPEC oil has tended to increase, as oil prices increase. Non-OPEC supply has been much less responsive to price. This is another way of graphing the relationship between oil price and oil production:
Figure 2. Relationship of oil production (crude and condensate) and West Texas Intermediate price, expressed in September 2010 $, based on monthly EIA data from January 2001 through September 2010.
In Figure 2, as oil price increases along the horizontal axis, we see that non-OPEC oil production remains virtually flat. As oil price increases for the OPEC 12, we see the kind of supply curve we might expect to see for a supplier that has a small amount of more expensive capacity that it can put on line when prices justify it. The catch is that the amount of supply added as prices rise isn’t really very much–as we just saw, 1.3 million barrels a day, between October 2007 and July 2008.
Eventually, the economy could not handle the high oil prices, and prices dropped. Credit availability began dropping and recession became a greater and greater issue.
Will this time be different? It seems to me that OPEC has done a good job of convincing the world that it has a lot of extra supply, but it is less than clear that it has much more excess capacity than it had in the 2007-2008 period. OPEC shows this image on its website, but this may just be a long-standing approach aimed at convincing the world that it has more oil (and power) than it really does.
Figure 3. OPEC’s view of its own spare capacity.
Spare capacity, like oil reserves, is not audited. The higher the numbers proclaimed to the world, the more powerful OPEC appears, both in the eyes of its own people, and in the eyes of people around the world. OPEC shows lists of new projects and investment amounts, but it is not clear that the new capacity being added is more than what is needed to offset declines in other fields. The new production amounts listed (shown separately by country–this is the one for Saudi Arabia) come to something like 6% of production – this could simply represent offsets to declines in fields elsewhere. The problem is we really don’t know, because no auditing is ever done. We are just expected to trust Saudi Arabia and OPEC on a matter of importance to the world.
OPEC tells us it is acting as a cartel, but when a person looks closely at the data, only three countries appear to be pumping at less than full capacity: Saudi Arabia, United Arab Emirates, and Kuwait. Production rises and falls with price for these countries. It is not all that difficult to coordinate the activities of three countries, especially when one of them–Saudi Arabia–is doing most of the adjustment to oil supply. So all of OPEC’s marvelous abilities may not be all that marvelous. If Saudi Arabia knows it can sell oil it withholds from the market at a higher price later, it is not a bad move to hold a bit of oil off the market, and claim that the amount being held off the market is much higher.
In the next year, there is a significant chance that oil demand may rise. While oil supplies are at this point adequate, if demand continues to grow, we could very well see another surge in oil prices, and another test as to whether there really is spare capacity. If the supply curves shown in Figure 2 are any indication, we won’t be getting much more oil, perhaps another 1.5 million barrels a day, even if prices spike.
The one possibility that would seem to postpone such a price run-up is if world economies in the very near term start heading into major recession. Such a recession might indicate that even the current oil price is too high for economies to handle, in their weakened state.
I believe the limit on how much oil will be supplied is not the amount of oil in the ground; rather the limit is how high a price economies can afford. This in turn is tied to the true value of the oil to society–whether oil can really be used to produce goods and services to justify its price. The problems we experienced in 2008, and may experience in the not-to-distant future, suggest that we may be reaching this limit.
Powered by WPtouch Mobile Suite for WordPress