 Digested Read – Spirit Level 4: Other Social Problems
Written By:
- Date published:
12:22 pm, September 25th, 2010 - 40 comments
Categories: equality -
Tags: spirit level
Digested Read Digested – Equality: better education and social mobility. Inequality: more teen pregnancies
Education is the future – it will be what creates or destroys the success of our society when the next generation has its turn to lead. So what produces the best outcomes? Good teachers in innovative classrooms, to be sure; but much more than that parental support. Parents with higher incomes and more education themselves have children who do better – but direct parental involvement is even more important. In turn children who do better at school will not just earn more, they will be more satisfied with their jobs, are far less likely to end up in prison, and more likely to be healthy and vote. How do we get this outcome for more of our children?

Although New Zealand does quite well at education, in general more equal societies do better. And they do better across the board. New Zealand and the UK’s reading scores are very high for a few who pull the average up – Scandinavian countries are much more consistent. Indeed in some research there’s a suspicion of under-representation of lower socio-economic groups in NZ and UK helping raise the average.
There are good reasons for more equal societies doing better. Parents will do better with more support – and more equal societies tend to provide that. Maternity leave is just the most obvious example: in the US & Australia there is no paid maternity leave at all, and in the US a woman may take only 12 weeks unpaid. In Sweden 18 months of parental leave at 80% of salary may be taken by either parent (or split between them).
And the results of that support and the difference in income can be stark: a UK study showed that 3 year-olds from disadvantaged homes were already 1 year behind in their development compared to those from privileged households.
The psychological effects matter too – in blind studies lower socio-economic children do better (and the wealthy worse), than in studies where status is made clear before children take the tests. Also interesting from a psychological point of view: although their educational results were better than less equal countries, more 15 year-olds aspire to less skilled work in more equal countries (eg 50% in Japan vs 15% in the US). The result being that those who cannot achieve university education are much happier with their lot as those jobs are not so stigmatised.
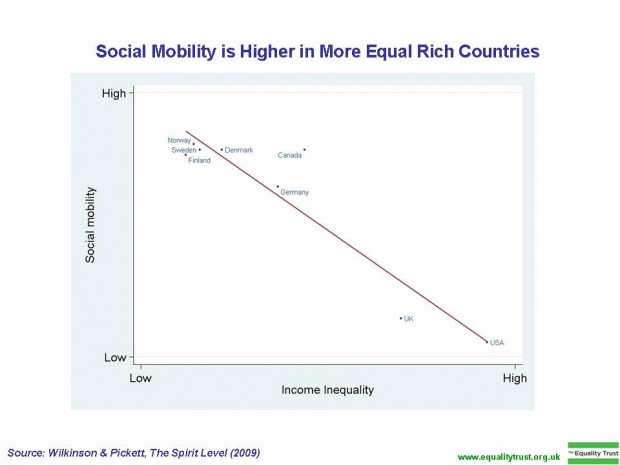
The American Dream says that anyone can grow up to do anything. But in fact social mobility is incredibly low in the US – if your father wasn’t wealthy, it’s highly unlikely you will be.
The number of countries with data here is low, which leads us to be cautious; but there has also been a large decrease in social mobility in the UK and US since 1980 – the same period that inequality has massively increased in those countries.
So far from inequality creating ‘incentives’ for people to move up, it instead creates sinkholes from which they cannot climb out.
The main driver of social mobility seems to be education – the connection to inequality of that is seen above – and in particular, publicly-funded education. The level of public-funding of education is in turn tightly correlated to inequality.
Another result of inequality and lack of social mobility has been that those ‘sinkholes’ have become geographical. As the wealthy move into gated communities, the poor end up left in ghettoes. And those economically disadvantaged end up doubly so when they are surrounded by people in the same boat. With the whole community lacking in resources, schools suffer, education outcomes suffer and social immobility is further enforced. Crime and violence are often left as the only way forward.
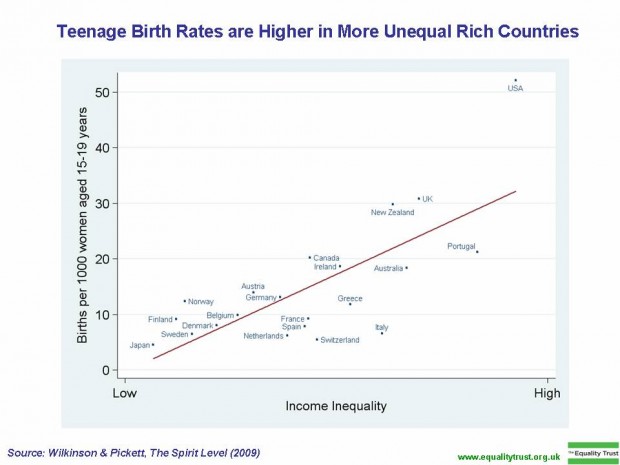
I mentioned the strong link over time for teen pregnancy rates vs inequality in the US in my previous post, but here’s the graph for between countries. It’s teen pregnancy births which is slightly affected by abortion rates, but a similar graph of the US states for conceptions shows a roughly parallel correlation. Indeed the biggest difference between conceptions and abortions is for the wealthier half of society – they are far more likely to abort and keep their own future prospects improved, where the poor are likely not to expect any good prospects anyway.
Even within the statistics hides a worse picture for unequal countries: in Japan, Italy and Greece, more than half of the teen pregnancies are within marriage (86% in Japan), where in NZ, US and UK that figure is less than a quarter. Another interesting statistic is that overall birth rates appear unaffected by inequality – suggesting fewer older mums to balance out the greater number of younger ones.
So why do less equal societies have more unmarried young mums – ‘babies having babies’? Like the young male violence it seems this is the only way these young women know how to gain status and adulthood. In turn they likely ruin both their own life chances (of education, work, social mobility, wealth…) and their children’s – those born to a teenage mother are much more likely to become one.
Absent fathers have a large part to play as well. Girls who grow up without a father are much more likely to become a teenage mother. But those young fathers from deprived backgrounds are unlikely to be able to offer much stability, income or support – and they have their own battles with inequality to occupy them. So the young mums console themselves with a strong relationship with their baby – their best chance of intimacy in their chaotic lives.
Next Friday: Sustainability.
–
For more detail: Read the book. Buy it and/or support the Trust.
Right-wing trolls: r0b had a recent post with links refuting the arguments you’re about to make…
40 comments on “Digested Read – Spirit Level 4: Other Social Problems ”
- Comments are now closed
Links to post
- Comments are now closed
Recent Comments
- Simon Clark: The climate lies you'll hear this year
 This video includes conclusions of the creator climate scientist Dr. Simon Clark. It is presented to our readers as an informed perspective. Please see video description for references (if any). This year you will be lied to! Simon Clark helps prebunk some misleading statements you'll hear about climate. The video includes ...39 mins ago
 - Cutting the Public Service
 It is all very well cutting the backrooms of public agencies but it may compromise the frontlines. One of the frustrations of the Productivity Commission’s 2017 review of universities is that while it observed that their non-academic staff were increasing faster than their academic staff, it did not bother to ...9 hours ago
 - Luxon’s demoted ministers might take comfort from the British politician who bounced back after th...
 Buzz from the Beehive Two speeches delivered by Foreign Affairs Minister Winston Peters at Anzac Day ceremonies in Turkey are the only new posts on the government’s official website since the PM announced his Cabinet shake-up. In one of the speeches, Peters stated the obvious: we live in a troubled ...12 hours ago
 - This is how I roll over
 1. Which of these would you not expect to read in The Waikato Invader?a. Luxon is here to do business, don’t you worry about thatb. Mr KPI expects results, and you better believe itc. This decisive man of action is getting me all hot and excitedd. Melissa Lee is how ...12 hours ago
 - The Waitangi Tribunal is not “a roving Commission”…
 …it has a restricted jurisdiction which must not be abused: it is not an inquisition NOTE – this article was published before the High Court ruled that Karen Chhour does not have to appear before the Waitangi Tribunal Gary Judd writes – The High Court ...15 hours ago
 - Is Oranga Tamariki guilty of neglect?Lindsay Mitchell writes – One of reasons Oranga Tamariki exists is to prevent child neglect. But could the organisation itself be guilty of the same? Oranga Tamariki’s statistics show a decrease in the number and age of children in care. “There are less children ...15 hours ago
- Three Strikes saw lower reoffendingDavid Farrar writes: Graeme Edgeler wrote in 2017: In the first five years after three strikes came into effect 5248 offenders received a ‘first strike’ (that is, a “stage-1 conviction” under the three strikes sentencing regime), and 68 offenders received a ‘second strike’. In the five years prior to ...15 hours ago
- Luxon’s ruthless show of strength is perfect for our angry eraBryce Edwards writes – Prime Minister Christopher Luxon has surprised everyone with his ruthlessness in sacking two of his ministers from their crucial portfolios. Removing ministers for poor performance after only five months in the job just doesn’t normally happen in politics. That’s refreshing and will be extremely ...16 hours ago
- 'Lacks attention to detail and is creating double-standards.'
 TL;DR: These are the six things that stood out to me in news and commentary on Aotearoa-NZ’s political economy in the two days to 6:06am on Thursday, April 25:Politics: PM Christopher Luxon has set up a dual standard for ministerial competence by demoting two National Cabinet ministers while leaving also-struggling ...21 hours ago
 - One Night Only!Hi,Today I mainly want to share some of your thoughts about the recent piece I wrote about success and failure, and the forces that seemingly guide our lives. But first, a quick bit of housekeeping: I am doing a Webworm popup in Los Angeles on Saturday May 11 at 2pm. ...22 hours ago
- What did Melissa Lee do?
 It is hard to see what Melissa Lee might have done to “save” the media. National went into the election with no public media policy and appears not to have developed one subsequently. Lee claimed that she had prepared a policy paper before the election but it had been decided ...22 hours ago
 - Skeptical Science New Research for Week #17 2024Open access notables Ice acceleration and rotation in the Greenland Ice Sheet interior in recent decades, Løkkegaard et al., Communications Earth & Environment: In the past two decades, mass loss from the Greenland ice sheet has accelerated, partly due to the speedup of glaciers. However, uncertainty in speed derived from satellite products ...1 day ago
- Maori Party (with “disgust”) draws attention to Chhour’s race after the High Court rules on Wa...Buzz from the Beehive A statement from Children’s Minister Karen Chhour – yet to be posted on the Government’s official website – arrived in Point of Order’s email in-tray last night. It welcomes the High Court ruling on whether the Waitangi Tribunal can demand she appear before it. It does ...2 days ago
- Who’s Going Up The Media Mountain?
 Mr Bombastic: Ironically, the media the academic experts wanted is, in many ways, the media they got. In place of the tyrannical editors of yesteryear, advancing without fear or favour the interests of the ruling class; the New Zealand news media of today boasts a troop of enlightened journalists dedicated to ...2 days ago
 - “That's how I roll”
 It's hard times try to make a livingYou wake up every morning in the unforgivingOut there somewhere in the cityThere's people living lives without mercy or pityI feel good, yeah I'm feeling fineI feel better then I have for the longest timeI think these pills have been good for meI ...2 days ago
 - “Comity” versus the rule of law
 In 1974, the US Supreme Court issued its decision in United States v. Nixon, finding that the President was not a King, but was subject to the law and was required to turn over the evidence of his wrongdoing to the courts. It was a landmark decision for the rule ...2 days ago
 - Aotearoa: a live lab for failed Right-wing socio-economic zombie experiments once more…
 Every day now just seems to bring in more fresh meat for the grinder. In their relentlessly ideological drive to cut back on the “excessive bloat” (as they see it) of the previous Labour-led government, on the mountains of evidence accumulated in such a short period of time do not ...2 days ago
 - Water is at the heart of farmers’ struggle to survive in BeninThis is a re-post from Yale Climate Connections by Megan Valére Sosou Market gardening site of the Itchèléré de Itagui agricultural cooperative in Dassa-Zoumè (Image credit: Megan Valère Sossou) For the residents of Dassa-Zoumè, a city in the West African country of Benin, choosing between drinking water and having enough ...2 days ago
- At a time of media turmoil, Melissa had nothing to proclaim as Minister – and now she has been dem...Buzz from the Beehive
 Melissa Lee – as may be discerned from the screenshot above – has not been demoted for doing something seriously wrong as Minister of ... 2 days ago
 - These people are not our friends
 Morning in London Mother hugs beloved daughter outside the converted shoe factory in which she is living.Afternoon in London Travelling writer takes himself and his wrist down to A&E, just to be sure. Read more ...2 days ago
 - Some advice from our tertiary history for the University Advisory GroupMike Grimshaw writes – The recent announcement of the University Advisory Group, chaired by Sir Peter Gluckman, makes very clear where the Government’s focus and priorities lie. The remit of the Advisory Group is that Group members will consider challenges and opportunities for improvement in the university sector including: ...3 days ago
- Still no prudential regulation case around climate changeEric Crampton writes – The Reserve Bank of New Zealand desperately wants to find reasons to have workstreams in climate change. It makes little sense. They’ve run another stress test on the banks looking to see if they could find a prudential regulation case. They couldn’t. They ...3 days ago
- Bernard’s pick ‘n’ mix of the news links for Wednesday, April 24
 TL;DR: These six news links stood out to me in the last 24 hours or so onWednesday, April 23:Scoop: 'Released in error': Treasury paper hints at axing $6b flood resilience plan by NZ Herald-$$$ Thomas CoughlanScoop: EY launches new misconduct review amid Fonterra ban. Fonterra tells EY to remove some ...3 days ago
 - How National can neutralise serious allegations of corruption should the “Fast Track” Bill becom...Rob MacCullough writes – Pundits from the left and the right are arguing that National’s Fast Track Bill that is designed to speed up infrastructure decisions could end up becoming mired in a cesspool of corruption. Political commentator ...3 days ago
- Cleaning Up After Gabrielle.
 Looking at the headlines this morning it’s hard to feel anything other than pessimistic about the future of humanity.Note that I’m not speaking about the future of mankind, but the survival of our humanity. The values that we believe in seem to be ebbing away, by the day.Perhaps every generation ...3 days ago
 - Gordon Campbell on bird flu, AUKUS entry fees and Cindy LeeSwabbing mixed breed baby chicks to test for avian influenzaUh oh. Bird flu – often deadly to humans – is not only being transmitted from infected birds to dairy cows, but is now travelling between dairy cows. As of last Friday, Bloomberg News reports, there were 32 American dairy herds ...3 days ago
- Tolling Existing Roads
 One of the government’s transport policy and agreements with it’s coalition partners made it clear that they were looking at options like tolling and road pricing. This was reinforced in it’s draft Government Policy Statement released at the start of March which made a couple of references to it. Road pricing, ...3 days ago
 - At a glance – The difference between weather and climateOn February 14, 2023 we announced our Rebuttal Update Project. This included an ask for feedback about the added "At a glance" section in the updated basic rebuttal versions. This weekly blog post series highlights this new section of one of the updated basic rebuttal versions and serves as a ...3 days ago
- More criminal minersWhat is it with the mining industry? Its not enough for them to pillage the earth - they apparently can't even be bothered getting resource consent to do so: The proponent behind a major mine near the Clutha River had already been undertaking activity in the area without a ...3 days ago
- Photos from the road
 Photo # 1 I am a huge fan of Singapore’s approach to housing, as described here two years ago by copying and pasting from The ConversationWhat Singapore has that Australia does not is a public housing developer, the Housing Development Board, which puts new dwellings on public and reclaimed land, ...3 days ago
 - RMA reforms aim to ease stock-grazing rules and reduce farmers’ costs – but Taxpayers’ Union w...Buzz from the Beehive Reactions to news of the government’s readiness to make urgent changes to “the resource management system” through a Bill to amend the Resource Management Act (RMA) suggest a balanced approach is being taken. The Taxpayers’ Union says the proposed changes don’t go far enough. Greenpeace says ...3 days ago
- Luxon Strikes Out.
 I’m starting to wonder if Anna Burns-Francis might be the best political interviewer we’ve got. That might sound unlikely to you, it came as a bit of a surprise to me.Jack Tame can be excellent, but has some pretty average days. I like Rebecca Wright on Newshub, she asks good ...4 days ago
 - In many ways the media that the experts wanted, turned out to be the media they have gotChris Trotter writes – Willie Jackson is said to be planning a “media summit” to discuss “the state of the media and how to protect Fourth Estate Journalism”. Not only does the Editor of The Daily Blog, Martyn Bradbury, think this is a good idea, but he has also ...4 days ago
- The Waitangi Tribunal Summons; or the more things stay the sameGraeme Edgeler writes – This morning [April 21], the Wellington High Court is hearing a judicial review brought by Hon. Karen Chhour, the Minister for Children, against a decision of the Waitangi Tribunal. This is unusual, judicial reviews are much more likely to brought against ministers, rather than ...4 days ago
- Both Parliamentary watchdogs hammer Fast-track billBoth of Parliament’s watchdogs have now ripped into the Government’s Fast-track Approvals Bill. Photo: Lynn Grieveson / The KākāMy pick of the six newsey things to know from Aotearoa’s political economy and beyond on the morning of Tuesday, April 23 are:The Lead: The Auditor General, John Ryan, has joined the ...4 days ago
- India makes a big bet on electric busesThis is a re-post from Yale Climate Connections by Sarah Spengeman People wait to board an electric bus in Pune, India. (Image credit: courtesy of ITDP) Public transportation riders in Pune, India, love the city’s new electric buses so much they will actually skip an older diesel bus that ...4 days ago
- Bernard’s pick ‘n’ mix of the news links at 6:36am on Tuesday, April 23
 TL;DR: These six news links stood out in the last 24 hours to 6:36am on Tuesday, April 22:Scoop & Deep Dive: How Sir Peter Jackson got to have his billion-dollar exit cake and eat Hollywood too NZ Herald-$$$ Matt NippertFast Track Approval Bill: Watchdogs seek substantial curbs on ministers' powers ...4 days ago
 - What is really holding up infrastructureThe infrastructure industry yesterday issued a “hurry up” message to the Government, telling it to get cracking on developing a pipeline of infrastructure projects.The hiatus around the change of Government has seen some major projects cancelled and others delayed, and there is uncertainty about what will happen with the new ...4 days ago
- “Pure Unadulterated Charge”
 Hi,Over the weekend I revisited a podcast I really adore, Dead Eyes. It’s about a guy who got fired from Band of Brothers over two decades ago because Tom Hanks said he had “dead eyes”.If you don’t recall — 2001’s Band of Brothers was part of the emerging trend of ...4 days ago
 - Bernard's six-stack of substacks for Monday, April 22
 Tonight’s six-stack includes: writes via his substack that’s he’s sceptical about the IPSOS poll last week suggesting a slide into authoritarianism here, writing: Kiwis seem to want their cake and eat it too Tal Aster writes for about How Israel turned homeowners into YIMBYs. writes via his ...4 days ago
 - The media were given a little list and hastened to pick out Fast Track prospects – but the Treaty ...Buzz from the Beehive The 180 or so recipients of letters from the Government telling them how to submit infrastructure projects for “fast track” consideration includes some whose project applications previously have been rejected by the courts. News media were quick to feature these in their reports after RMA Reform Minister Chris ...4 days ago
- Just trying to stay upright
 It would not be a desirable way to start your holiday by breaking your back, your head, or your wrist, but on our first hour in Singapore I gave it a try.We were chatting, last week, before we started a meeting of Hazel’s Enviro Trust, about the things that can ...4 days ago
 - “Unprecedented”Today, former Port of Auckland CEO Tony Gibson went on trial on health and safety charges for the death of one of his workers. The Herald calls the trial "unprecedented". Firstly, it's only "unprecedented" because WorkSafe struck a corrupt and unlawful deal to drop charges against Peter Whittall over Pike ...4 days ago
- Bryce Edwards: Time for “Fast-Track Watch”
 Calling all journalists, academics, planners, lawyers, political activists, environmentalists, and other members of the public who believe that the relationships between vested interests and politicians need to be scrutinised. We need to work together to make sure that the new Fast-Track Approvals Bill – currently being pushed through by the ...5 days ago
 - Gordon Campbell on fast track powers, media woes and the Tiktok banFeel worried. Shane Jones and a couple of his Cabinet colleagues are about to be granted the power to override any and all objections to projects like dams, mines, roads etc even if: said projects will harm biodiversity, increase global warming and cause other environmental harms, and even if ...5 days ago
- The Government’s new fast-track invitation to corruption
 Bryce Edwards writes- The ability of the private sector to quickly establish major new projects making use of the urban and natural environment is to be supercharged by the new National-led Government. Yesterday it introduced to Parliament one of its most significant reforms, the Fast Track Approvals Bill. ...5 days ago
 - Maori push for parallel government structuresMichael Bassett writes – If you think there is a move afoot by the radical Maori fringe of New Zealand society to create a parallel system of government to the one that we elect at our triennial elections, you aren’t wrong. Over the last few days we have ...5 days ago
- An announcement about an announcementWithout a corresponding drop in interest rates, it’s doubtful any changes to the CCCFA will unleash a massive rush of home buyers. Photo: Lynn GrievesonTL;DR: The six things that stood out to me in Aotearoa’s political economy around housing, poverty and climate on Monday, April 22 included:The Government making a ...5 days ago
- All the Green Tech in China.
 Sunday was a lazy day. I started watching Jack Tame on Q&A, the interviews are usually good for something to write about. Saying the things that the politicians won’t, but are quite possibly thinking. Things that are true and need to be extracted from between the lines.As you might know ...5 days ago
 - Western Express SuccessIn our Weekly Roundup last week we covered news from Auckland Transport that the WX1 Western Express is going to get an upgrade next year with double decker electric buses. As part of the announcement, AT also said “Since we introduced the WX1 Western Express last November we have seen ...5 days ago
- Bernard’s pick ‘n’ mix of the news links at 7:16am on Monday, April 22
 TL;DR: These six news links stood out in the last 24 hours to 7:16am on Monday, April 22:Labour says Kiwis at greater risk from loan sharks as Govt plans to remove borrowing regulations NZ Herald Jenee TibshraenyHow did the cost of moving two schools blow out to more than $400m?A ...5 days ago
 - The Kaka’s diary for the week to April 29 and beyond
 TL;DR: The six key events to watch in Aotearoa-NZ’s political economy in the week to April 29 include:PM Christopher Luxon is scheduled to hold a post-Cabinet news conference at 4 pm today. Stats NZ releases its statutory report on Census 2023 tomorrow.Finance Minister Nicola Willis delivers a pre-Budget speech at ...5 days ago
 - 2024 SkS Weekly Climate Change & Global Warming News Roundup #16A listing of 29 news and opinion articles we found interesting and shared on social media during the past week: Sun, April 14, 2024 thru Sat, April 20, 2024. Story of the week Our story of the week hinges on these words from the abstract of a fresh academic ...5 days ago
- Bryce Edwards: The Government’s new fast-track invitation to corruptionThe ability of the private sector to quickly establish major new projects making use of the urban and natural environment is to be supercharged by the new National-led Government. Yesterday it introduced to Parliament one of its most significant reforms, the Fast Track Approvals Bill. The Government says this will ...6 days ago
- Thank you
 This is a column to say thank you. So many of have been in touch since Mum died to say so many kind and thoughtful things. You’re wonderful, all of you. You’ve asked how we’re doing, how Dad’s doing. A little more realisation each day, of the irretrievable finality of ...6 days ago
 - Determining the Engine Type in Your Car
 Identifying the engine type in your car is crucial for various reasons, including maintenance, repairs, and performance upgrades. Knowing the specific engine model allows you to access detailed technical information, locate compatible parts, and make informed decisions about modifications. This comprehensive guide will provide you with a step-by-step approach to ...6 days ago
 - How to Become a Race Car Driver: A Comprehensive GuideIntroduction: The allure of racing is undeniable. The thrill of speed, the roar of engines, and the exhilaration of competition all contribute to the allure of this adrenaline-driven sport. For those who yearn to experience the pinnacle of racing, becoming a race car driver is the ultimate dream. However, the ...6 days ago
- How Many Cars Are There in the World in 2023? An Exploration of Global Automotive StatisticsIntroduction Automobiles have become ubiquitous in modern society, serving as a primary mode of transportation and a symbol of economic growth and personal mobility. With countless vehicles traversing roads and highways worldwide, it begs the question: how many cars are there in the world? Determining the precise number is a ...6 days ago
- How Long Does It Take for Car Inspection?Maintaining a safe and reliable vehicle requires regular inspections. Whether it’s a routine maintenance checkup or a safety inspection, knowing how long the process will take can help you plan your day accordingly. This article delves into the factors that influence the duration of a car inspection and provides an ...6 days ago
- Who Makes Mazda Cars?Mazda Motor Corporation, commonly known as Mazda, is a Japanese multinational automaker headquartered in Fuchu, Aki District, Hiroshima Prefecture, Japan. The company was founded in 1920 as the Toyo Cork Kogyo Co., Ltd., and began producing vehicles in 1931. Mazda is primarily known for its production of passenger cars, but ...6 days ago
- How Often to Replace Your Car Battery A Comprehensive GuideYour car battery is an essential component that provides power to start your engine, operate your electrical systems, and store energy. Over time, batteries can weaken and lose their ability to hold a charge, which can lead to starting problems, power failures, and other issues. Replacing your battery before it ...6 days ago
- Can You Register a Car Without a License?In most states, you cannot register a car without a valid driver’s license. However, there are a few exceptions to this rule. Exceptions to the Rule If you are under 18 years old: In some states, you can register a car in your name even if you do not ...6 days ago
- Mazda: A Comprehensive Evaluation of Reliability, Value, and PerformanceMazda, a Japanese automotive manufacturer with a rich history of innovation and engineering excellence, has emerged as a formidable player in the global car market. Known for its reputation of producing high-quality, fuel-efficient, and driver-oriented vehicles, Mazda has consistently garnered praise from industry experts and consumers alike. In this article, ...6 days ago
- What Are Struts on a Car?Struts are an essential part of a car’s suspension system. They are responsible for supporting the weight of the car and damping the oscillations of the springs. Struts are typically made of steel or aluminum and are filled with hydraulic fluid. How Do Struts Work? Struts work by transferring the ...6 days ago
- What Does Car Registration Look Like: A Comprehensive GuideCar registration is a mandatory process that all vehicle owners must complete annually. This process involves registering your car with the Department of Motor Vehicles (DMV) and paying an associated fee. The registration process ensures that your vehicle is properly licensed and insured, and helps law enforcement and other authorities ...6 days ago
- How to Share Computer Audio on ZoomZoom is a video conferencing service that allows you to share your screen, webcam, and audio with other participants. In addition to sharing your own audio, you can also share the audio from your computer with other participants. This can be useful for playing music, sharing presentations with audio, or ...6 days ago
- How Long Does It Take to Build a Computer?Building your own computer can be a rewarding and cost-effective way to get a high-performance machine tailored to your specific needs. However, it also requires careful planning and execution, and one of the most important factors to consider is the time it will take. The exact time it takes to ...6 days ago
- How to Put Your Computer to SleepSleep mode is a power-saving state that allows your computer to quickly resume operation without having to boot up from scratch. This can be useful if you need to step away from your computer for a short period of time but don’t want to shut it down completely. There are ...6 days ago
- What is Computer-Assisted Translation (CAT)?Introduction Computer-Assisted Translation (CAT) has revolutionized the field of translation by harnessing the power of technology to assist human translators in their work. This innovative approach combines specialized software with human expertise to improve the efficiency, accuracy, and consistency of translations. In this comprehensive article, we will delve into the ...6 days ago
- iPad vs. Tablet Computers A Comprehensive Guide to DifferencesIn today’s digital age, mobile devices have become an indispensable part of our daily lives. Among the vast array of portable computing options available, iPads and tablet computers stand out as two prominent contenders. While both offer similar functionalities, there are subtle yet significant differences between these two devices. This ...6 days ago
- How Are Computers Made?A computer is an electronic device that can be programmed to carry out a set of instructions. The basic components of a computer are the processor, memory, storage, input devices, and output devices. The Processor The processor, also known as the central processing unit (CPU), is the brain of the ...6 days ago
- How to Add Voice Memos from iPhone to ComputerVoice Memos is a convenient app on your iPhone that allows you to quickly record and store audio snippets. These recordings can be useful for a variety of purposes, such as taking notes, capturing ideas, or recording interviews. While you can listen to your voice memos on your iPhone, you ...6 days ago
- Why My Laptop Screen Has Lines on It: A Comprehensive GuideLaptop screens are essential for interacting with our devices and accessing information. However, when lines appear on the screen, it can be frustrating and disrupt productivity. Understanding the underlying causes of these lines is crucial for finding effective solutions. Types of Screen Lines Horizontal lines: Also known as scan ...6 days ago
- How to Right-Click on a LaptopRight-clicking is a common and essential computer operation that allows users to access additional options and settings. While most desktop computers have dedicated right-click buttons on their mice, laptops often do not have these buttons due to space limitations. This article will provide a comprehensive guide on how to right-click ...6 days ago
- Where is the Power Button on an ASUS Laptop?Powering up and shutting down your ASUS laptop is an essential task for any laptop user. Locating the power button can sometimes be a hassle, especially if you’re new to ASUS laptops. This article will provide a comprehensive guide on where to find the power button on different ASUS laptop ...6 days ago
- Gaza: Aotearoa Must Support Independent Investigation into Mass GravesTe Pāti Māori are demanding the New Zealand Government support an international independent investigation into mass graves that have been uncovered at two hospitals on the Gaza strip, following weeks of assault by Israeli troops. Among the 392 bodies that have been recovered, are children and elderly civilians. Many of ...13 hours ago
- Release: Working together on consistent support for veterans this Anzac Day
 Our two-tiered system for veterans’ support is out of step with our closest partners, and all parties in Parliament should work together to fix it, Labour veterans’ affairs spokesperson Greg O’Connor said. ...2 days ago
 - Release: Penny drops – but what about Seymour and Peters?Stripping two Ministers of their portfolios just six months into the job shows Christopher Luxon’s management style is lacking, Labour Leader Chris Hipkins said. ...3 days ago
- Another ‘Stolen Generation’ enabled by court ruling on Waitangi Tribunal summonsTonight’s court decision to overturn the summons of the Children’s Minister has enabled the Crown to continue making decisions about Māori without evidence, says Te Pāti Māori spokesperson for Children, Mariameno Kapa-Kingi. “The judicial system has this evening told the nation that this government can do whatever they want when ...3 days ago
- Release: Budget blunder shows Nicola Willis could cut recovery fundingIt appears Nicola Willis is about to pull the rug out from under the feet of local communities still dealing with the aftermath of last year’s severe weather, and local councils relying on funding to build back from these disasters. ...3 days ago
- Further environmental mismanagement on the cards
 The Government’s resource management reforms will add to the heavy and ever-growing burden this Government is loading on to our environment. ...4 days ago
 - Release: RMA changes will be a disaster for environmentThe Government is making short-sighted changes to the Resource Management Act (RMA) that will take away environmental protection in favour of short-term profits, Labour’s environment spokesperson Rachel Brooking said today. ...4 days ago
- Release: Labour supports urgent changes to emergency management systemLabour welcomes the release of the report into the North Island weather events and looks forward to working with the Government to ensure that New Zealand is as prepared as it can be for the next natural disaster. ...4 days ago
- Release: Labour calls for New Zealand to recognise PalestineThe Labour Party has called for the New Zealand Government to recognise Palestine, as a material step towards progressing the two-State solution needed to achieve a lasting peace in the region. ...4 days ago
- Release: Three strikes law political posturing of worst kindThe Government is bringing back a law that has little evidential backing just to look tough, Labour justice spokesperson Duncan Webb said. ...4 days ago
- Release: Government cuts unbelievably target child exploitation, violent extremism, ports and airpor...Some of our country’s most important work, stopping the sexual exploitation of children and violent extremism could go along with staff on the frontline at ports and airports. ...4 days ago
- Three strikes has failed before and will fail againResurrecting the archaic three-strikes legislation is an unwelcome return to a failed American-style approach to justice. ...5 days ago
- Release: Environmental protection vital, not ‘onerous’The Government’s Fast Track Approvals Bill will give projects such as new coal mines a ‘get out of jail free’ card to wreak havoc on the environment, Labour Leader Chris Hipkins said today. ...5 days ago
- Ferris – Three Strikes targets those ‘too brown to be white’The government's decision to reintroduce Three Strikes is a destructive and ineffective piece of law-making that will only exacerbate an inherently biased and racist criminal justice system, said Te Pāti Māori Justice Spokesperson, Tākuta Ferris, today. During the time Three Strikes was in place in Aotearoa, Māori and Pasifika received ...5 days ago
- Release: Govt cuts doctors and nurses in hiring freezeCuts to frontline hospital staff are not only a broken election promise, it shows the reckless tax cuts have well and truly hit the frontline of the health system, says Labour Health spokesperson Ayesha Verrall. ...1 week ago
- Fast-track submissions period must be extendedThe Green Party has joined the call for public submissions on the fast-track legislation to be extended after the Ombudsman forced the Government to release the list of organisations invited to apply just hours before submissions close. ...1 week ago
- Release: Progress on climate will be undone by GovtNew Zealand’s good work at reducing climate emissions for three years in a row will be undone by the National government’s lack of ambition and scrapping programmes that were making a difference, Labour Party climate spokesperson Megan Woods said today. ...1 week ago
- Release: Dark day for Kiwi kids as a third of Govt cuts affect themNews that 1000 jobs at the Ministry of Education and Oranga Tamariki could go is devastating for future generations of New Zealanders. ...1 week ago
- Release: Alarm as Government signals further blow to school lunchesMore essential jobs could be on the chopping block, this time Ministry of Education staff on the school lunches team are set to find out whether they're in line to lose their jobs. ...1 week ago
- Oranga Tamariki cuts commit tamariki to state abuseTe Pāti Māori is disgusted at the confirmation that hundreds are set to lose their jobs at Oranga Tamariki, and the disestablishment of the Treaty Response Unit. “This act of absolute carelessness and out of touch decision making is committing tamariki to state abuse.” Said Te Pāti Māori Oranga Tamariki ...1 week ago
- Release: Quick, submit – stop Govt’s dodgy approvals billThe Government is trying to bring in a law that will allow Ministers to cut corners and kill off native species, Labour environment spokesperson Rachel Brooking said. ...2 weeks ago
- Government throws coal on the climate crisis fireThe Government’s policy announced today to ease consenting for coal mining will have a lasting impact across generations. ...2 weeks ago
- Release: Public transport costs to double as National looks at unaffordable roading project insteadCancelling urgently needed new Cook Strait ferries and hiking the cost of public transport for many Kiwis so that National can announce the prospect of another tunnel for Wellington is not making good choices, Labour Transport Spokesperson Tangi Utikere said. ...2 weeks ago
- Release: Cost of living in Auckland still not a priorityA laundry list of additional costs for Tāmaki Makarau Auckland shows the Minister for the city is not delivering for the people who live there, says Labour Auckland Issues spokesperson Shanan Halbert. ...2 weeks ago
- Te Pāti Māori to visit Queensland to strengthen ties with Māori in AustraliaTe Pāti Māori co-leader Rawiri Waititi, and Mema Paremata mō Tāmaki-Makaurau, Takutai Tarsh Kemp, will travel to the Gold Coast to strengthen ties with Māori in Australia next week (15-21 April). The visit, in the lead-up to the 9th Australian National Kapa haka Festival, will be an opportunity for both ...2 weeks ago
- Greens look to fast-track submissions on harmful lawThe Green Party has today launched a step-by-step guide to help New Zealanders make their voice heard on the Government’s democracy dodging and anti-environment fast track legislation. ...2 weeks ago
- Release: Govt should stop making people’s lives harder and build more homesThe National Government’s proposed changes to the Residential Tenancies Act will mean tenants can be turfed from their homes by landlords with little notice, Labour housing spokesperson Kieran McAnulty said. ...2 weeks ago
- Release: Melissa Lee missing in action on mediaThe action Melissa Lee promised to protect democracy and the media sector is missing, Media and Communications spokesperson Willie Jackson said. ...2 weeks ago
- Landlord Government leaves little hope for rentersThe Government’s announcement on tenancy rules prove that it does not care about renters. ...2 weeks ago
- Opportunity to build a more sustainable economyGreen Party co-leader Marama Davidson is calling on all parties to support a common-sense change that’s great for the planet and great for consumers after her member’s bill was drawn from the ballot today. ...2 weeks ago
- Significant step forward in fixing cruel and unjust pastA significant milestone has been reached in the fight to strike an anti-Pasifika and unfair law from the country’s books after Teanau Tuiono’s members’ bill passed its first reading. ...2 weeks ago
- Missed opportunity but NZ will surely one day recognise the right to a sustainable environmentNew Zealand has today missed the opportunity to uphold the right to a clean, healthy, and sustainable environment, says James Shaw after his member’s bill was voted down in its first reading. ...2 weeks ago
- Release: Don’t cut our lunches – clear message sent to GovernmentTens of thousands of people are demanding the Government commits to fully funding free and healthy school lunches. ...2 weeks ago
- Release: Govt makes U-turn on Suicide Prevention OfficeLabour welcomes the Government’s U-turn on the closure of the Suicide Prevention Office, says Labour Mental Health spokesperson Ingrid Leary. ...2 weeks ago
- CCC issues warning over further climate delayToday’s advice from the Climate Change Commission paints a sobering reality of the challenge we face in combating climate change, especially in light of recent Government policy announcements. ...3 weeks ago
- Luxon targets lame and lousy example of leadershipIf talk is cheap, Chris Luxon’s “targets” are bankrupt. ...3 weeks ago
- Luxon targets are lousy example of leadershipIf talk is cheap, Chris Luxon’s “targets” are bankrupt. ...3 weeks ago
- Release: Commitment to disability communities missing from Govt prioritiesMinister for Disability Issues Penny Simmonds appears to have delayed a report back to Cabinet on the progress New Zealand is making against international obligations for disabled New Zealanders. ...3 weeks ago
- Anzac Commemorative Address, Buttes New British Cemetery Belgium
 Ambassador Millar, Burgemeester, Vandepitte, Excellencies, military representatives, distinguished guests, ladies and gentlemen – good morning and welcome to this sacred Anzac Day dawn service. It is an honour to be here on behalf of the Government and people of New Zealand at Buttes New British Cemetery, Polygon Wood – a deeply ...12 hours ago
 - Anzac Commemorative Address – NZ National Service, Chunuk BairDistinguished guests - It is an honour to return once again to this site which, as the resting place for so many of our war-dead, has become a sacred place for generations of New Zealanders. Our presence here and at the other special spaces of Gallipoli is made ...1 day ago
- Anzac Commemorative Address – Dawn Service, Gallipoli, TürkiyeMai ia tawhiti pamamao, te moana nui a Kiwa, kua tae whakaiti mai matou, ki to koutou papa whenua. No koutou te tapuwae, no matou te tapuwae, kua honoa pumautia. Ko nga toa kua hinga nei, o te Waipounamu, o te Ika a Maui, he okioki tahi me o ...2 days ago
- PM announces changes to portfoliosPaul Goldsmith will take on responsibility for the Media and Communications portfolio, while Louise Upston will pick up the Disability Issues portfolio, Prime Minister Christopher Luxon announced today. “Our Government is relentlessly focused on getting New Zealand back on track. As issues change in prominence, I plan to adjust Ministerial ...3 days ago
- New catch limits for unique fishery areasRecreational catch limits will be reduced in areas of Fiordland and the Chatham Islands to help keep those fisheries healthy and sustainable, Oceans and Fisheries Minister Shane Jones says. The lower recreational daily catch limits for a range of finfish and shellfish species caught in the Fiordland Marine Area and ...3 days ago
- Minister welcomes hydrogen milestoneEnergy Minister Simeon Brown has welcomed an important milestone in New Zealand’s hydrogen future, with the opening of the country’s first network of hydrogen refuelling stations in Wiri. “I want to congratulate the team at Hiringa Energy and its partners K one W one (K1W1), Mitsui & Co New Zealand ...3 days ago
- Urgent changes to system through first RMA Amendment BillThe coalition Government is delivering on its commitment to improve resource management laws and give greater certainty to consent applicants, with a Bill to amend the Resource Management Act (RMA) expected to be introduced to Parliament next month. RMA Reform Minister Chris Bishop has today outlined the first RMA Amendment ...4 days ago
- Overseas decommissioning models consideredOverseas models for regulating the oil and gas sector, including their decommissioning regimes, are being carefully scrutinised as a potential template for New Zealand’s own sector, Resources Minister Shane Jones says. The Coalition Government is focused on rebuilding investor confidence in New Zealand’s energy sector as it looks to strengthen ...4 days ago
- Release of North Island Severe Weather Event InquiryEmergency Management and Recovery Minister Mark Mitchell has today released the Report of the Government Inquiry into the response to the North Island Severe Weather Events. “The report shows that New Zealand’s emergency management system is not fit-for-purpose and there are some significant gaps we need to address,” Mr Mitchell ...4 days ago
- Justice Minister to attend Human Rights CouncilJustice Minister Paul Goldsmith is today travelling to Europe where he’ll update the United Nations Human Rights Council on the Government’s work to restore law and order. “Attending the Universal Periodic Review in Geneva provides us with an opportunity to present New Zealand’s human rights progress, priorities, and challenges, while ...4 days ago
- Patterson reopens world’s largest wool scouring facilityAssociate Agriculture Minister, Mark Patterson, formally reopened the world’s largest wool processing facility today in Awatoto, Napier, following a $50 million rebuild and refurbishment project. “The reopening of this facility will significantly lift the economic opportunities available to New Zealand’s wool sector, which already accounts for 20 per cent of ...5 days ago
- Speech to the Southland Otago Regional Engineering Collective Summit, 18 April 2024Hon Andrew Bayly, Minister for Small Business and Manufacturing At the Southland Otago Regional Engineering Collective (SOREC) Summit, 18 April, Dunedin Ngā mihi nui, Ko Andrew Bayly aho, Ko Whanganui aho Good Afternoon and thank you for inviting me to open your summit today. I am delighted ...5 days ago
- Government to introduce revised Three Strikes lawThe Government is delivering on its commitment to bring back the Three Strikes legislation, Associate Justice Minister Nicole McKee announced today. “Our Government is committed to restoring law and order and enforcing appropriate consequences on criminals. We are making it clear that repeat serious violent or sexual offending is not ...5 days ago
- New diplomatic appointmentsForeign Minister Winston Peters has today announced four new diplomatic appointments for New Zealand’s overseas missions. “Our diplomats have a vital role in maintaining and protecting New Zealand’s interests around the world,” Mr Peters says. “I am pleased to announce the appointment of these senior diplomats from the ...5 days ago
- Humanitarian support for Ethiopia and SomaliaNew Zealand is contributing NZ$7 million to support communities affected by severe food insecurity and other urgent humanitarian needs in Ethiopia and Somalia, Foreign Minister Rt Hon Winston Peters announced today. “Over 21 million people are in need of humanitarian assistance across Ethiopia, with a further 6.9 million people ...5 days ago
- Arts Minister congratulates Mataaho CollectiveMinister for Arts, Culture and Heritage Paul Goldsmith is congratulating Mataaho Collective for winning the Golden Lion for best participant in the main exhibition at the Venice Biennale. "Congratulations to the Mataaho Collective for winning one of the world's most prestigious art prizes at the Venice Biennale. “It is good ...6 days ago
- Supporting better financial outcomes for KiwisThe Government is reforming financial services to improve access to home loans and other lending, and strengthen customer protections, Commerce and Consumer Affairs Minister Andrew Bayly and Housing Minister Chris Bishop announced today. “Our coalition Government is committed to rebuilding the economy and making life simpler by cutting red tape. We are ...6 days ago
- Trade relationship with China remains strong“China remains a strong commercial opportunity for Kiwi exporters as Chinese businesses and consumers continue to value our high-quality safe produce,” Trade and Agriculture Minister Todd McClay says. Mr McClay has returned to New Zealand following visits to Beijing, Harbin and Shanghai where he met ministers, governors and mayors and engaged in trade and agricultural events with the New ...6 days ago
- PM’s South East Asia mission does the businessPrime Minister Christopher Luxon has completed a successful trip to Singapore, Thailand and the Philippines, deepening relationships and capitalising on opportunities. Mr Luxon was accompanied by a business delegation and says the choice of countries represents the priority the New Zealand Government places on South East Asia, and our relationships in ...7 days ago
- $41m to support clean energy in South East AsiaNew Zealand is demonstrating its commitment to reducing global greenhouse emissions, and supporting clean energy transition in South East Asia, through a contribution of NZ$41 million (US$25 million) in climate finance to the Asian Development Bank (ADB)-led Energy Transition Mechanism (ETM). Prime Minister Christopher Luxon and Climate Change Minister Simon Watts announced ...1 week ago
- Minister releases Fast-track stakeholder listThe Government is today releasing a list of organisations who received letters about the Fast-track applications process, says RMA Reform Minister Chris Bishop. “Recently Ministers and agencies have received a series of OIA requests for a list of organisations to whom I wrote with information on applying to have a ...1 week ago
- Judicial appointments announcedAttorney-General Judith Collins today announced the appointment of Wellington Barrister David Jonathan Boldt as a Judge of the High Court, and the Honourable Justice Matthew Palmer as a Judge of the Court of Appeal. Justice Boldt graduated with an LLB from Victoria University of Wellington in 1990, and also holds ...1 week ago
- Education Minister heads to major teaching summit in SingaporeEducation Minister Erica Stanford will lead the New Zealand delegation at the 2024 International Summit on the Teaching Profession (ISTP) held in Singapore. The delegation includes representatives from the Post Primary Teachers’ Association (PPTA) Te Wehengarua and the New Zealand Educational Institute (NZEI) Te Riu Roa. The summit is co-hosted ...1 week ago
- Value of stopbank project proven during cycloneA stopbank upgrade project in Tairawhiti partly funded by the Government has increased flood resilience for around 7000ha of residential and horticultural land so far, Regional Development Minister Shane Jones says. Mr Jones today attended a dawn service in Gisborne to mark the end of the first stage of the ...1 week ago
- Anzac commemorations, Türkiye relationship focus of visitForeign Affairs Minister Winston Peters will represent the Government at Anzac Day commemorations on the Gallipoli Peninsula next week and engage with senior representatives of the Turkish government in Istanbul. “The Gallipoli campaign is a defining event in our history. It will be a privilege to share the occasion ...1 week ago
- Minister to Europe for OECD meeting, Anzac DayScience, Innovation and Technology and Defence Minister Judith Collins will next week attend the OECD Science and Technology Ministerial conference in Paris and Anzac Day commemorations in Belgium. “Science, innovation and technology have a major role to play in rebuilding our economy and achieving better health, environmental and social outcomes ...1 week ago
- Comprehensive Partnership the goal for NZ and the PhilippinesPrime Minister Christopher Luxon held a bilateral meeting today with the President of the Philippines, Ferdinand Marcos Jr. The Prime Minister was accompanied by MP Paulo Garcia, the first Filipino to be elected to a legislature outside the Philippines. During today’s meeting, Prime Minister Luxon and President Marcos Jr discussed opportunities to ...1 week ago
- Government commits $20m to Westport flood protectionThe Government has announced that $20 million in funding will be made available to Westport to fund much needed flood protection around the town. This measure will significantly improve the resilience of the community, says Local Government Minister Simeon Brown. “The Westport community has already been allocated almost $3 million ...1 week ago
- Taupō takes pole positionThe Government is proud to support the first ever Repco Supercars Championship event in Taupō as up to 70,000 motorsport fans attend the Taupō International Motorsport Park this weekend, says Economic Development Minister Melissa Lee. “Anticipation for the ITM Taupō Super400 is huge, with tickets and accommodation selling out weeks ...1 week ago
- Cost of living support for low-income homeownersLocal Government Minister Simeon Brown has announced an increase to the Rates Rebate Scheme, putting money back into the pockets of low-income homeowners. “The coalition Government is committed to bringing down the cost of living for New Zealanders. That includes targeted support for those Kiwis who are doing things tough, such ...1 week ago
- Government backing mussel spat projectThe Coalition Government is investing in a project to boost survival rates of New Zealand mussels and grow the industry, Oceans and Fisheries Minister Shane Jones has announced. “This project seeks to increase the resilience of our mussels and significantly boost the sector’s productivity,” Mr Jones says. “The project - ...1 week ago
- Government focused on getting people into workBenefit figures released today underscore the importance of the Government’s plan to rebuild the economy and have 50,000 fewer people on Jobseeker Support, Social Development and Employment Minister Louise Upston says. “Benefit numbers are still significantly higher than when National was last in government, when there was about 70,000 fewer ...1 week ago
- Clean energy key driver to reducing emissionsThe Government’s commitment to doubling New Zealand’s renewable energy capacity is backed by new data showing that clean energy has helped the country reach its lowest annual gross emissions since 1999, Climate Change Minister Simon Watts says. New Zealand’s latest Greenhouse Gas Inventory (1990-2022) published today, shows gross emissions fell ...1 week ago
- Earthquake-prone buildings review brought forwardThe Government is bringing the earthquake-prone building review forward, with work to start immediately, and extending the deadline for remediations by four years, Building and Construction Minister Chris Penk says. “Our Government is focused on rebuilding the economy. A key part of our plan is to cut red tape that ...1 week ago
- Thailand and NZ to agree to Strategic PartnershipPrime Minister Christopher Luxon and his Thai counterpart, Prime Minister Srettha Thavisin, have today agreed that New Zealand and the Kingdom of Thailand will upgrade the bilateral relationship to a Strategic Partnership by 2026. “New Zealand and Thailand have a lot to offer each other. We have a strong mutual desire to build ...1 week ago
- Government consults on extending coastal permits for portsRMA Reform Minister Chris Bishop and Transport Minister Simeon Brown have today announced the Coalition Government’s intention to extend port coastal permits for a further 20 years, providing port operators with certainty to continue their operations. “The introduction of the Resource Management Act in 1991 required ports to obtain coastal ...1 week ago
- Inflation coming down, but more work to doToday’s announcement that inflation is down to 4 per cent is encouraging news for Kiwis, but there is more work to be done - underlining the importance of the Government’s plan to get the economy back on track, acting Finance Minister Chris Bishop says. “Inflation is now at 4 per ...1 week ago
- School attendance restored as a priority in health adviceRefreshed health guidance released today will help parents and schools make informed decisions about whether their child needs to be in school, addressing one of the key issues affecting school attendance, says Associate Education Minister David Seymour. In recent years, consistently across all school terms, short-term illness or medical reasons ...1 week ago
- Unnecessary bureaucracy cut in oceans sectorOceans and Fisheries Minister Shane Jones is streamlining high-level oceans management while maintaining a focus on supporting the sector’s role in the export-led recovery of the economy. “I am working to realise the untapped potential of our fishing and aquaculture sector. To achieve that we need to be smarter with ...1 week ago
- Opinion: It’s time for an arts and creative sector strategyI was initially resistant to the idea often suggested to me that the Government should deliver an arts strategy. The whole point of the arts and creativity is that people should do whatever the hell they want, unbound by the dictates of politicians in Wellington. Peter Jackson, Kiri Te Kanawa, Eleanor ...1 week ago
- Have New Zealanders really been ‘misled’ about AUKUS, or is involvement now a foregone conclusio...
 ANALYSIS: By Marco de Jong, Auckland University of Technology and Robert G. Patman, University of Otago When former prime minister Helen Clark spoke out against New Zealand potentially compromising its independent foreign policy by joining pillar two of the AUKUS security pact, Foreign Minister Winston Peters responded bluntly: On ...4 hours ago
 - Palestine protesters challenge TVNZ over Israeli ambassador’s ‘propaganda’Pacific Media Watch Palestine solidarity protesters today demonstrated at the Auckland headquarters of Television New Zealand, accusing the country’s major TV network of broadcasting “propaganda” backing Israel’s genocidal war on Gaza. About 50 protesters targeted the main entrance to the TVNZ building near Sky Tower and also picketed a side ...5 hours ago
- Lynley Hood Opinion – Senator Fulbright must be spinning in his grave6 hours ago
- Fast-track bill could affect NZ's reputation – Transparency International
 The ministers responsible for green-lighting major projects need to be open about potential conflicts of interest, says Transparency International. ...7 hours ago
 - We’re all feeling the collective grief and trauma of violence against women – but this is the pr...Source: The Conversation (Au and NZ) – By Anastasia Powell, Professor, Family and Sexual Violence, RMIT University It has been a particularly distressing start to the year. There is little that can ease the current grief of individuals, families and communities who have needlessly lost a loved one to men’s ...8 hours ago
- Species living closely together in symbiosis is far older and way more common than you might thinkSource: The Conversation (Au and NZ) – By Gregory Moore, Senior Research Associate, School of Ecosystem and Forest Sciences, The University of Melbourne Lichen, the first described example of symbiosis. AdeJ Artventure/Shutterstock Once known only to those studying biology, the word symbiosis is now widely used. Symbiosis is the intimate ...8 hours ago
- What is childhood dementia? And how could new research help?Source: The Conversation (Au and NZ) – By Kim Hemsley, Head, Childhood Dementia Research Group, Flinders Health and Medical Research Institute, College of Medicine and Public Health, Flinders University Olena Ivanova/Shutterstock “Childhood” and “dementia” are two words we wish we didn’t have to use together. But sadly, around 1,400 ...9 hours ago
- Jobseekers get about $345 less than pensioners each fortnight. This gap is hurting, and is set to wi...Source: The Conversation (Au and NZ) – By Peter Whiteford, Professor, Crawford School of Public Policy, Australian National University The government’s Economic Inclusion Advisory Committee has just published its second report. It was set up by Treasurer Jim Chalmers and Minister for Social Services Amanda Rishworth in 2022 to provide: ...10 hours ago
- Does fighting inflation always lead to recession? What NZ data tellsHere is what 60 years of New Zealand data shows us. ...10 hours ago
- The government's 20 trips abroad in AprilThe government appears committed to overseas visits with 14 ministers and MPs in 18 countries this month. ...11 hours ago
- Government unveils fetal alcohol guidelines, plan for diagnosis trainingThe government is promising to step up the response to Fetal Alcohol Spectrum Disorder, promising to boost diagnoses and raise awareness. ...11 hours ago
- Labor facing heavy defeat in Queensland, but faring better in federal pollsSource: The Conversation (Au and NZ) – By Adrian Beaumont, Election Analyst (Psephologist) at The Conversation; and Honorary Associate, School of Mathematics and Statistics, The University of Melbourne The Queensland state election will be held in October. A YouGov poll for The Courier Mail, conducted April 9–17 from a sample ...12 hours ago
- Why the potential for another Donald Trump presidency is making Iran very nervousSource: The Conversation (Au and NZ) – By Amin Naeni, PhD candidate at Alfred Deakin Institute for Citizenship and Globalisation, Deakin University There’s been much talk in recent months about what a possible second Donald Trump presidency in the United States could mean for Europe, Russia’s war in Ukraine, the ...12 hours ago
- ‘The worst piece of law proposed since 1979’: Reactions to the Fast-track Approvals Bill
 A brief round-up of submissions on the controversial proposed law. This is an excerpt from our weekly environmental newsletter Future Proof. Sign up here. Last week, submissions on the controversial Fast-track Approvals Bill closed just hours after the government released a list of stakeholder organisations who were sent letters advising how they could ...13 hours ago
 - The Friday Poem: ‘Cereal giving’ by Robin PeaceA poem from Robin Peace’s new collection Detritus of Empire: feather / grass / rock. Cereal giving I see a woman’s hands, see her curious hands break a stalk as she walks through the tall prairie, the savannah, the steppe, wherever it was. See her idly bite the grass that ...13 hours ago
- The Unity Books bestseller chart for the week ending April 26The only published and available best-selling indie book chart in New Zealand is the top 10 sales list recorded every week at Unity Books’ stores in High St, Auckland, and Willis St, Wellington. AUCKLAND 1 Hemingway’s Goblet by Dermot Ross (Mary Egan Publishing, $38) A handsomely produced (debossed cover, lovely ...13 hours ago
- Te Rūnanga O Ngāti Whātua Welcomes Commissioner's Decision Regarding Awataha Marae
 The Commissioner's decision validates the longstanding efforts of the local community and ensures that Awataha Marae will be managed to serve the needs of the local community, particularly for hosting tangihanga. ...14 hours ago
 - We reconstructed landscapes that greeted the first humans in Australia around 65,000 years agoSource: The Conversation (Au and NZ) – By Tristan Salles, Associate professor, University of Sydney Examples of Australian landscapes. Unsplash Seventy thousand years ago, the sea level was much lower than today. Australia, along with New Guinea and Tasmania, formed a connected landmass known as Sahul. Around this time – ...14 hours ago
- What do we lose when our old suburbs disappear?Source: The Conversation (Au and NZ) – By Felicity Castagna, Lecturer, Creative Writing, Western Sydney University Day Day Market, Parramatta Photo: Garry Trinh I live on the edge of Parramatta, Australia’s fastest-growing city, on the kind of old-fashioned suburban street that has 1950s fibros constructed in the post-war housing boom, ...14 hours ago
- Does fighting inflation always lead to recession? What 60 years of NZ data can tell usSource: The Conversation (Au and NZ) – By Michael Ryan, Teaching Fellow in Economics, University of Waikato GettyImages fatido/Getty Images There is an ongoing global debate over whether the high inflation seen in the aftermath of the COVID-19 pandemic can be lowered without a recession. New Zealand is not ...14 hours ago
- After spending $700,000 on pins for Covid-19 workers, department now cutting costsA government office that set aside millions for lapel pins for pandemic workers is now looking to cut back on spending. ...15 hours ago
- ‘A hell of a lot of fun’: Our reviews of Chris Isaak’s dazzling Auckland showThe ‘Wicked Game’ heartthrob is in his late 60s now. That didn’t stop him putting on a lively, goofy and very sparkly show. Apart from ‘Wicked Game’, which graces a sultry playlist of mine simply called 💋, my last sustained Chris Isaak listening session took place when I was about ...15 hours ago
- The Week in Politics: Days of drama and demotionsAnalysis - Two ministers were stripped of portfolios in a warning to Cabinet, drama broke out at the Waitangi Tribunal, and the gang patch ban bill ran into opposition. ...15 hours ago
- Hear me out: All I want is a TrueBliss T-shirtTara Ward makes an impassioned plea for some vital pop culture merch. In April 1999, I became obsessed with a new reality television show called Popstars. Every Tuesday night, five strangers transformed into music royalty before my very eyes as Joe, Keri, Carly, Erika and Megan were chosen to form ...17 hours ago
- Solemn ANZAC dawn service at PNG’s Isurava battle memorialPNG Post-Courier In the early hours of ANZAC Day, aerial photographs captured an impressive gathering of Australians and Papua New Guineans at Isurava in the Northern (Oro) Province. The solemn dawn service yesterday was held at a site steeped in history, where some of the fiercest battles of World War ...17 hours ago
- Political editors panel: A reshuffle and the fast trackListen - RNZ's Jo Moir and NZ Herald's Claire Trevett dissect the demotion of two ministers and the PM's response on Morning Report. ...18 hours ago
- After-hours clinics on verge of collapse in some regionsOverworked GPs have signalled they can no longer cover, while funding is falling short. ...18 hours ago
- Oranga Tamariki Axes Specialist Māori Roles, Weakens Commitment To Te Ao MāoriThe PSA is shocked that Oranga Tamariki has used the cost cutting drive to downgrade its commitment to Te Ao Māori and remove many specialist Māori roles. ...18 hours ago
- China’s money only goes so far – Kokoda shows why history binds PNG and Australia in a far deepe...Source: The Conversation (Au and NZ) – By Ian Kemish, Adjunct Professor, School of Historical and Philosophical Inquiry, The University of Queensland There can be no more powerful symbol of the relationship between Australia and Papua New Guinea than the prime ministers of these neighbouring countries walking together on the ...18 hours ago
- We spoke to young people about sexual consent. They understand the concept, but don’t always ask i...Source: The Conversation (Au and NZ) – By Andrea Waling, ARC DECRA Senior Research Fellow in Sex & Sexuality, La Trobe University BAZA Production/Shutterstock Sexual consent has been a major focus in Australia for the past few years. In early 2022 the federal government mandated consent education in ...18 hours ago
- Longer-lasting ozone holes over Antarctica expose seal pups and penguin chicks to much more UVSource: The Conversation (Au and NZ) – By Sharon Robinson, Distinguished Professor and Deputy Director of ARC Securing Antarctica’s Environmental Future (SAEF), University of Wollongong, University of Wollongong Andrew Netherwood Over the last 25 years, the ozone hole which forming over Antarctica each spring has started to shrink. ...18 hours ago
- Granting legal ‘personhood’ to nature is a growing movement – can it stem biodiversity loss?Source: The Conversation (Au and NZ) – By Viktoria Kahui, Senior Lecturer in Environmental Economics, University of Otago Getty Images/Amy Toensing Biodiversity is declining at rates unprecedented in human history. This suggests the ways we currently use to manage our natural environment are failing. One emerging concept focuses on ...18 hours ago
- Will checking character references really help you find the best candidate for a job?Source: The Conversation (Au and NZ) – By Timothy Colin Bednall, Associate Professor in Management, Swinburne University of Technology marvent/Shutterstock Finding the best person to fill a position can be tough, from drafting a job ad to producing a shortlist of top interview candidates. Employers typically consider information from ...18 hours ago
- A guide to Wellington’s best BYO restaurantsWondering where to host your next BYO? Whether its a small gathering or a massive party, we’ve got some recommendations. I was first introduced to the concept of BYOs at Dunedin’s India Gardens, a legendary but sadly defunct establishment, which purveyed enormous quantities of mango chicken to Aotearoa’s drunkest future ...18 hours ago
- New rock art discoveries in Eastern Sudan tell a tale of ancient cattle, the ‘green Sahara’ and ...Source: The Conversation (Au and NZ) – By Julien Cooper, Honorary Lecturer, Department of History and Archaeology, Macquarie University Julien Cooper The hyper-arid desert of Eastern Sudan, the Atbai Desert, seems like an unlikely place to find evidence of ancient cattle herders. But in this dry environment, my new ...18 hours ago
- Paul Goldsmith starts as new Media Minister replacing sacked Melissa LeeThe media industry is "under pressure", Paul Goldsmith says, but he plans to plot a path forward as he takes up the difficult role. ...19 hours ago
- Media industry sheds few tears for minister LeeThe sector says it’s hopeful her replacement Paul Goldsmith will be able to throw it a lifeline, after six months with a minister deemed missing in action, writes Catherine McGregor in this excerpt from The Bulletin, The Spinoff’s morning news round-up. To receive The Bulletin in full each weekday, sign ...20 hours ago
- Is NZ bringing in 'Indonesian coal every month to keep the lights on'?Analysis: The Resource Minister said it, but is it true and why does it matter? ...20 hours ago
- More spending cuts needed to stablise government finances – economistThe government can't just rely on axing public sector jobs and has to do more to cut spending, says the chief economist at a free market think tank. ...20 hours ago
- The government's 22 trips abroad in AprilThe government appears committed to overseas visits with 14 miniters and MPs in 18 countries this month. ...21 hours ago
- Loopholes will be exploited in new vape rules – expertsThere is no doubt vape manufacturers will find and exploit loopholes in new regulations, say marketing experts. ...21 hours ago
- Aotearoa Party Merges With Rock The Vote NZ Party And John Alcock Elected As Party LeaderRock The Vote NZ, known for its advocacy for minor party unity and its role within the Freedoms NZ Coalition during the 2023 General Election, celebrates this merger as a strategic enhancement of its operational strength and outreach. ...21 hours ago
- After spending $2m on pins for Covid-19 workers, department now cutting costsGovernment department that spent $2m on lapel pins to honour Covid-19 workers is now looking to make cuts. ...22 hours ago
- An afternoon at the Repair Café, where everyday objects get a second lifeNearly everyone has experienced the frustration of something you use breaking and being difficult or expensive to fix. Proposed legislation could change that. It’s been raining on and off all Sunday afternoon but people are lining up outside a building in a corner of Gribblehirst Park in Sandringham, Auckland. In ...22 hours ago
- Dreaming of my not-wedding dayWhat does a forever relationship look like when you don’t believe in marriage? And how do you celebrate it? This essay is part of our Sunday Essay series, made possible thanks to the support of Creative New Zealand. I’m going to do it, right now. I’m going to say ...22 hours ago
- On the fringes of the Gallipoli battlefield
 You can’t have missed the Gallipoli story as the movies, documentaries, essays and books capture what it was like for New Zealand troops in their eight-month campaign on the Peninsula. But this Anzac Day the Auckland War Memorial Museum has published a book that sheds light on a little-known aspect of the ...22 hours ago
 - Govt repeats mistakes of Muldoon’s authoritarian excessesOpinion: It needs wiser leadership to learn from the past to have a balanced planning and resource management law The post Govt repeats mistakes of Muldoon’s authoritarian excesses appeared first on Newsroom. ...22 hours ago
- Debt clifftop guardrail and ambulance removed at same timeIt will be soon be easier to get lending, but harder to get help for debt The post Debt clifftop guardrail and ambulance removed at same time appeared first on Newsroom. ...22 hours ago
- Just Life exit from NZX puts listed company regulation under microscopeJust Life’s chief executive says the exchange’s regulatory burden outweighs any benefits to small business The post Just Life exit from NZX puts listed company regulation under microscope appeared first on Newsroom. ...22 hours ago
- Prime Minister jumps the gun in ThailandThe Prime Minister has committed to resuming direct flights to Thailand. But it’s not a promise he will be able to deliver on anytime soon. The post Prime Minister jumps the gun in Thailand appeared first on Newsroom. ...22 hours ago
- Daily crossword, Friday 26 AprilThe post Daily crossword, Friday 26 April appeared first on Newsroom. ...22 hours ago
- The outlook for engineering specialists looks bleakOpinion: Delays getting to the starting line of new programmes of work are causing significant disruption across the sector The post The outlook for engineering specialists looks bleak appeared first on Newsroom. ...22 hours ago
- Eliza wants more than a last tango in ParisIt’s not that long ago Eliza McCartney was seriously wondering if the Paris Olympics would be her pole vaulting swansong. After years of being hounded by injury after injury, the Rio Olympics bronze medallist was still confident she would compete at her second Olympics in Paris in July, unless something ...22 hours ago
- This week’s bestselling books – April 26FICTION 1 Take Two by Danielle Hawkins (Allen & Unwin, $36.99) There’s commercial fiction, like this book, and then there’s quality fiction, quality writers, quality literature; the forthcoming Auckland Writers Festival is full of quality, and ReadingRoom has two tickets to give away to the following events: Paul Lynch (Dublin ...22 hours ago
- Newsroom daily quiz, Friday 26 AprilLoading…(function(i,s,o,g,r,a,m){var ql=document.querySelectorAll('A[quiz],DIV[quiz],A[data-quiz],DIV[data-quiz]'); if(ql){if(ql.length){for(var k=0;k<ql.length;k++){ql[k].id='quiz-embed-'+k;ql[k].href="javascript:var i=document.getElementById('quiz-embed-"+k+"');try{qz.startQuiz(i)}catch(e){i.start=1;i.style.cursor='wait';i.style.opacity='0.5'};void(0);"}}};i['QP']=r;i[r]=i[r]||function(){(i[r].q=i[r].q||[]).push(arguments)},i[r].l=1*new Date();a=s.createElement(o),m=s.getElementsByTagName(o)[0];a.async=1;a.src=g;m.parentNode.insertBefore(a,m)})(window,document,'script','https://take.quiz-maker.com/3012/CDN/quiz-embed-v1.js','qp'); Got a good quiz question? Send Newsroom your questions. The post Newsroom daily quiz, Friday 26 April appeared first on Newsroom. ...22 hours ago
- Grattan on Friday: Social media companies can’t be immune from the need for a social licenceSource: The Conversation (Au and NZ) – By Michelle Grattan, Professorial Fellow, University of Canberra In the free-for-all between the Australian government and Big Tech boss Elon Musk this week, the government had to be on a winner. Most people would have little sympathy with Musk’s vociferous opposition to ...1 day ago
- Nelson Mandela’s grandson joins Gaza flotilla, slams ‘genocide complicit’ leadersAsia Pacific Report Chief Mandla Mandela, a member of the National Assembly of South Africa and Nelson Mandela’s grandson, has joined the Freedom Flotilla in istanbul as the ships prepare to sail for Gaza, reports Kia Ora Gaza. Mandela is also the ambassador for the Global Campaign to Return to ...1 day ago
- 200 journalists ‘targeted’ over their environment reporting, warns RSFPacific Media Watch Journalists who report on environmental issues are encountering growing difficulties in many parts of the world, reports Reporters Without Borders. According to the tally kept by RSF, 200 journalists have been subjected to threats and physical violence, including murder, in the past 10 years because they were ...1 day ago
- Bryce Edwards Analysis – Luxon’s ruthless show of strength is perfect for our angry eraAnalysis by Dr Bryce Edwards, Democracy Project (https://democracyproject.nz) Political scientist, Dr Bryce Edwards. Prime Minister Christopher Luxon has surprised everyone with his ruthlessness in sacking two of his ministers from their crucial portfolios. Removing ministers for poor performance after only five months in the job just doesn’t normally happen in ...1 day ago
- David Seymour: Auckland Grammar School ANZAC Day AddressThis speech was delivered to Auckland Grammar students, family, Old Boys, and staff on ANZAC Day 2024 by David Seymour ’97, MP for Epsom. ...1 day ago
- David Seymour: Auckland Grammar School ANZAC Day AddressThis speech was delivered to Auckland Grammar students, family, Old Boys, and staff on ANZAC Day 2024 by David Seymour ’97, MP for Epsom. ...1 day ago
- Inflation is slowly falling while student debt is climbing: 6 graphs that explain the CPISource: The Conversation (Au and NZ) – By John Hawkins, Senior Lecturer, Canberra School of Politics, Economics and Society, University of Canberra BagzhanSadvakassov/Upsplash, CC BY-SA Australia’s inflation rate has fallen for the fifth successive quarter, and it’s now less than half of what it was back in late 2022. ...1 day ago
- Response To ANZAC Day ProtestsACT's Rural Communities and Veterans spokesman Mark Cameron responds to cancellations and protests of ANZAC Day commemorations in Wellington. He says, "These pitiful attempts to detract from ANZAC Day are not at all indicative of the feelings of mainstream ...1 day ago
- Claimants want Children's Minister to front up kanohi ki te kanohi (face to face)Waitangi Tribunal claimants will appeal a High Court decision to overturn a summons order from the Tribunal for Children's Minister Karen Chhour. ...1 day ago
- ‘It bucked our lads up wonderfully’: the lightning-quick battle that marked the birth of the US-...Source: The Conversation (Au and NZ) – By Meighen McCrae, Associate Professor of Strategic & Defence Studies, Australian National University American and Australian stretcher bearers working together near the front line during the Battle of Hamel in 1918. Australian War Memorial While the AUKUS alliance is new, the Australian-American partnership ...2 days ago
- GCSB refuses to release details of spy deal 'to protect interests'The spy agency is refusing to release a copy of its deal with a foreign agency to run a secret operation out of this country. ...2 days ago
- Die In for Palestine Marks ANZAC dayPōneke based peace activists staged a silent protest at the ANZAC day service to highlight New Zealand’s complicity in war and genocide, and urge the government to take concrete steps to stop the genocide in Palestine. ...2 days ago
- Ancient nomads you’ve probably never heard of disappeared from Europe 1,000 years ago. Now, DNA an...Source: The Conversation (Au and NZ) – By Magdalena M.E. Bunbury, Postdoctoral Researcher, James Cook University Burial with a horse at the Rákóczifalva site, Hungary (8th century AD). Sándor Hegedűs, Hungarian National Museum, CC BY How do we understand past societies? For centuries, our main sources of information have been ...2 days ago
- Don’t mention the war: On grandparents and Anzac biscuitsAmanda Thompson doesn’t really do Anzac Day. But what she does do is remember the people she knew who had a lifetime to remember stuff they didn’t really want to, because of a war they didn’t ask for. And she does make Anzac biscuits. First published in 2021. All my ...2 days ago
- If plastic manufacturing goes up 10%, plastic pollution goes up 10% – and we’re set for a huge ...Source: The Conversation (Au and NZ) – By Kathryn Willis, Postdoctoral Researcher, CSIRO Xavier Boulenger/Shutterstock In the two decades to 2019, global plastic production doubled. By 2040, plastic manufacturing and processing could consume as much as 20% of global oil production and use up 15% of the annual carbon ...2 days ago
- Governor-General's Anzac Day Dawn Service AddressWith our collective remembrance, and steadfast belief in our common humanity, we strengthen our hope and resolve to do what we can to foster dialogue and understanding, and to heal divisions in our pursuit of peace. ...2 days ago
- Angling-Conservation Group Sees Fast Track Bill As UndemocraticPrincipal reasons for the opposition is the loss of the public’s democratic right to have “a fair say” and the vital need for a government free from corruption, said Casey Cravens of Dunedin, president of the New Zealand Federation of Freshwater ...2 days ago
- Remembering the great TrueBliss vs Bardot national anthem sing-offNever mind the scoreboard – in the 2000 Bledisloe Cup decider, the real trans-Tasman battle was won before kickoff. First published in 2016. The dawn of the new millennium was a dark time for the All Blacks. Their final game pre-Y2K was a 22-18 loss to South Africa in the ...2 days ago
- Help Me Hera: Do I even want the public sector job I might be about to lose?I’m on the wrong side of 40, I never pursued creative work and now my job is killing my soul. Help! Want Hera’s help? Email your problem to helpme@thespinoff.co.nz Dear Hera, May I start with the least original conversation opener you’re likely to hear around the motu at the moment, particularly in Wellington: ...2 days ago
- ANZAC Day Wreath Calls For No Future Deaths From AUKUS“Never again - No AUKUS” was the message of the wreath laid at this morning’s national ANZAC Day commemorative service at Pukeahu National War Memorial Park this morning by the Stop AUKUS group. ...2 days ago
(*Burt) “Equally you could say that warmer weather causes slower economic growth, since most countries situated close to the equator are relatively poor”.
No Burt – there’s no way of tieing those together, and there haven’t been hundreds of neuanced studies on the topic that have been compared with each other to reach robust conclusions…
Does that save us from Burt?
*”Burt” is being used here only as a random name and in no way refers to a person and/or personality thaat comments regularly at The Standard.
The first graph plots “average maths and reading scores” over income inequality.
This is clearly an instance where the correlation is around the wrong way. “Average maths and reading scores” could be considered a proxy for general IQ. General IQ is highly likely to predict income. For instance, in the link provided notice the high levels of poverty associated with low IQ. Those with IQ of 75 or less had by far the highest proportion living in poverty. It is also known that IQ is the best predictor of job performance. So people who are more intelligent are also likely to be more successful.
“General IQ is highly likely to predict income…..It is also known that IQ is the best predictor of job performance. So people who are more intelligent are also likely to be more successful.”
If I was to point out all the exceptions to that rule, you’d probably yell ‘anecdotal evidence’, tsmithfield. But really, your arguments are utter bollices…
Outlier alert. Graph 2. Complete nonsense.
Are you saying that the U.S. and the U.K. don’t count? That’d be weird.
Why do you think I said any such thing?
Here is what I said with respect to a graph from the previous article in the series:
All I am saying here is the analysis method is completely wrong for the data on this occasion.
It is almost as if the authors have tried the method I have recommended above, found no correlation so thought, “shit, we’d better use a method that does give a trend”. This is one of the things that concerns me a lot. And should concern you as well. The authors seem to choose their analysis methods on the basis of what will prove their thesis.
Another thing, why have they gone and cut out most of the countries on that graph (graph 2).
Did you get a substantially different result?
Clearly, if the same method was used as they had used in the graph I commended, there would be little or no trend at all. Besides the fact that there are far too few data points on that graph to use regression any way. You didn’t answer my question about why they excluded so many of the countries on that graph BTW. Compare that graph to the other graphs in this article for instance.
I can’t answer your question because I know nothing about it – stats aren’t my area at all. I’m just trying to learn a bit more about where you’re coming from.
Can’t blame you. Stats is the sort of area that if you haven’t been using it for awhile, its easy to forget. 🙂 So I don’t proclaim to be an expert at all.
However, a simple way to see the problem is to compare a mean (average) with a median (middle) score.
Consider the following series:
15, 19, 22, 23, 24, 26, 160.
Here, the score “160” could be considered an outlier.
The average (mean) for the series above is 41.28. The median (middle score) is 23. Measures of central tendency should be quite similar in value in normally distributed data. But here you can see that the single score “160” is considerably inflating the average score above the median score, giving a result that is clearly out of line with the rest of the series.
I would conduct this sort of analysis as a very basic test before determining how to treat the data in more complex analysis.
In this sort of situation, one would normally either trim off the outlier if using a “mean” (average) based method of analysis such as least squares regression that appears to have been used on the graph. Or use a method of analysis that is not based on the “mean” (average) to determine the trend so that it is not unduly affected by the outlier.
The problem I have with a lot of the “spirit level” stuff is that they seem to have chosen the method to suit what they want to find. For instance, there are some charts, as I pointed out the other day, where there is clearly a nice trend in the main body of data points, so they appear to have been happy to use a method that excludes the effect of obvious outliers. However, where there is no clear trend in the main body of data, they seem happy to use a method that is highly affected by that outlier.
In graph 2 of this series, see what sort of trend line you would get if you covered up the UK and US. That is not to say these data points are unimportant. Just that the analysis method is wrong.
I hope that helps.
Outliers should not always be rejected:
http://cnx.org/content/m17094/latest/
What look like outliers may actually be ‘influential points’ which can actually improve the reliability of the correlation.
http://stattrek.com/AP-Statistics-1/Residual.aspx?Tutorial=Stat
Fair point. And I am aware of the need to study outliers.
However, consider the point I have made below. I would rather show a weaker trend not relying on an outlier than include it and leave the door open to the critiicism. I like to understate rather than overstate data in a study. This makes the case much more convincing.
If the trend is reliable it should be present regardless of outliers. In a number of the graphs I have seen from “the spirit level” the trend is entirely dependent on the inclusion of the outliers. Therefore, I still hold that it has not been justifiable to include the outliers, even on the basis of the point you have just made.
In the case above, the authors would need to provide considerable justification as to why the outlier was included. That starts getting into the realm of the subjective. What some consider as important, others might not.
Also, the inconsistency of how they have apparently used different analysis methods depending on whether a trend was obvious or not is something that is quite concerning.
You didn’t answer my question about why they excluded so many of the countries on that graph BTW.
Unfortunately my father still has my copy so I can’t answer directly but it’s probably for the simple reason that usable data on ‘social mobility’ may only be available for those countries.
Sure it would be nice to have perfect data for everything, but we don’t. That doesn’t mean we cannot make reasonable inferences from incomplete, imperfect information. Makes the job more interesting and fun.
Hi TS, to quote the authors:
“Comparable international data on inter-generational social mobility are available for only a few or our rich countries [i.e., those developed countries chosen for clear reasons expounded by the authors in their book and on the Equality Trust website]. We take our figures from a study by economist Jo Blanden and colleagues at the London School of Economics. Using large, representative longitudinal studies for eight countries, these researchers were able to calculate social mobility as the correlation between fathers’ incomes when their sons were born and sons’ incomes at age thirty. Despite having data for only eight countries, the relationship between inter-generational social mobility and income inequality is very strong.” (p. 159)
So, in answer to your question: There’s only eight countries because there’s no data for others. Also, the relationship was found by economists from the LSE. While it’s no guarantee, you’d expect economists from the LSE would get basic stats right in a publication from the Centre for Economic Performance at the LSE – wouldn’t you?
I don’t know, Puddlegum. I’ve seen some pretty bad stuff in published “peer reviewed” articles from time to time. See my reply to Felix above.
Hat Tip Hot Topic
TS, here’s a 2009 update from Joanne Blanden on what is now known about intergenerational mobility in international comparisons.
You’ll note, in the Conclusions section, confirmation of the general inverse relationship between inequality and mobility but also the interesting difference in different mobility measures for Germany and the US. In the US income mobility is very low but there’s some mobility in terms of education and social class between generations. The reverse in Germany.
At a glance, her statistical proficiency looks ok to me.
Thanks Puddlegum.
I am not trying to argue if the construct is valid or not. It is the methods used in analysis that I have a problem with.
In the case of graph 2, rather than try and find trends in the data points, a more interesting question to me would have been why the UK and US are so different than the other countries. That might have led to a similar conclusion. However, it would have been a much more valid way of getting there.
Fair enough.
Pearson’s r is affected by outliers. So let’s follow what you suggest and ignore the fact that the correlation for the eight countries is strong (r=0.93, p<0.01).
The funny thing is, if most people were asked what was different about the US and UK (compared with the other countries included) they'd probably say more economic freedom, neo-liberalism, etc.. Yet, oddly, they are the lowest on mobility, so that kind of ‘freedom’ doesn’t seem to generate mobility. Mobility here is measured by ‘father-son’ incomes, not educational attainment or social status.
I’d add in defence of W&P that if you read pages 159-160 in their book you’ll find that they are deliberately cautious and they only include it because of a range of other observations in the literature (e.g., on social mobility changes over time within the US and other countries, spending on education, etc., etc.) which they then go on to detail. They note that it is those additional observations that “lend plausibility to the picture we see in Figure 12.1”.
They’re not trying to pull the wool over anyone’s eyes, TS – it’s clear when you read the book.
Puddlegum, the reason the correlation is strong is due to the inclusion of the outliers. So I wouldn’t read too much into those figures. Given there are only eight data points, a very steep slope is about the only way a low p value could be achieved.
I accept they have qualified their inclusion of the graph. However, I think there are much better ways they could have analysed the data to make their point. What they have done in presenting the data is really quite meaningless.
Maybe But given we are talking about two countries out of many, there could be other significant differences as well that could account for the affect. We simply don’t know. Since there is a reliance on data from only eight countries, I simply don’t think there was enough data to make any conclusion.
What they could have done was simply summarized the previous research they cite to make their point rather than try and display data in a way that is really quite shabby.
I think you’re getting a bit contradictory. You say “there are much better ways they could have analysed the data to make their point” and then say “Since there is a reliance on data from only eight countries, I simply don’t think there was enough data to make any conclusion”.
Either their analysis and display of data was ‘shabby’ but could have been done better through alternative analyses or there’s nothing in the data. Which is it?
What they did was show an analysis that was ambiguous and open to interpretation but could be supported by additional observations (data). In that context, the analysis was not ‘shabby’ but, rather, was consistent with what else is known about mobility and inequality. That is, it represents another brick in quite a big evidential wall.
Remember that, while the correlation is not robust, that doesn’t make it wrong. Scientists are detectives and they piece together the evidence in ways that seem to make sense of as many data as possible.
W&P are not concluding anything from the graph in and of itself – that’s why they discuss other evidence that makes that apparent correlation seem more plausible. It’s just not true to say it’s ‘shabby’ of them to present the regression lines, given that they acknowledge its limitations and provide further evidence to suggest it may well show something real.
Quite genuinely, this is how science progresses, for better or worse.
The other thing is that I very much doubt that with only 8 data points they would be able to satisfy the underlying assumptions of normally distributed data that is required for reliable use of regression techniques.
I accept that this is not all they were relying on. However, I think I still have a valid point in that including the graph weakens their argument rather than strengthens it. And I have seen a number of other examples where they have done the same thing. So its not an isolated case. All it achieves is to attract criticism toward what might otherwise be a very good study. I actually like statistical analysis, and my eyes tend to roll back into my head when I see this sort of thing. Then I tend to feel quite skeptical about anything else they say.
What would be better would be time-series data from one country (say the US) correlated against changes in income equality over that time-frame.
Further to my comments above, the general criticism I have of “the spirit level” is as follows:
Sometimes its what is left out that strengthens an argument. If I were doing this “spirit level” study and felt I had a really strong argument, I would cut out anything that was the slightest bit dodgy and just leave in the really strong stuff.
In this case, I would have definitely excluded graph 2. The reason is that only having data for eight countries out of the 50 odd they decided to include in their study is simply too few to be convincing. We don’t know what the trend would have looked like had their been a heap more data points, so that graph isn’t at all convincing, without even thinking about whether their analysis method is appropriate or not.
The way they have done it has left it open for people such as myself to find fault with what they have done. When I see what appears to be quite a naive approach to data analysis, it makes me feel quite dubious about the study as a whole. If they had focused on the strong stuff I would have been more impressed.
See my comment just above. There’s a bit more known now.
See my reply to your last post.
Ditto (I’m just trying to be the 200,000th commenter!)
Um – just because there are weaker points beside stronger arguments does not mean that the stronger arguments are invalid. Particularly if the topic is a larger picture that covers many different areas and aspects.
I can’t figure out your purpose, TS. Are you suggesting that because one graph in the post might have issues, then the bigger claim that inequality is associated with a number of other negatives is therefore in doubt? Are you going to put similar effort into all the other graphs?
Or do you agree with the gist of the Spirit Level as summarised in the post, but just like getting anal about statistics in lieu of an actual point?
“Um – just because there are weaker points beside stronger arguments does not mean that the stronger arguments are invalid. Particularly if the topic is a larger picture that covers many different areas and aspects.”
True enough. However, the weaker points can tend to obfuscate the stronger ones; or undermine the stronger points if fallacious ones are included. So why keep them in?
“I can’t figure out your purpose, TS. Are you suggesting that because one graph in the post might have issues, then the bigger claim that inequality is associated with a number of other negatives is therefore in doubt? Are you going to put similar effort into all the other graphs?”
Except its not just one graph. As I pointed out above, the authors are prone to doing this sort of thing. There are a number of issues I have about the way the authors appear to have done things.
“Or do you agree with the gist of the Spirit Level as summarised in the post, but just like getting anal about statistics in lieu of an actual point?”
To be fair, I haven’t actually read the book itself. Hence, it is unreasonable for me to be drawing firm conclusions about the book itself. That is why discussions with the likes of Puddlegum is quite interesting; in that he has read the book and appears to have a good knowledge of scientific method etc.
I have read a lot of scientific reports in the past based on statistics, and they are very careful about methods they use, justification for those methods etc. Because I have some knowledge in statistics, I am also very aware of how statistics can be misused. So, although it may seem a bit “anal” I like to think I do have a point. 🙂
However, the weaker points can tend to obfuscate the stronger ones; or undermine the stronger points if fallacious ones are included. So why keep them in?
ummm… because if they were left out folks like you would have accused them of ‘cherry picking’?
TS, to date you have written probably as much on this book as the original authors.As such you probably have a body of work that you might publish in the best spirit of free and open market competition with the original authors. Why dont you do this, really, no kidding. Then we can do two things: one see how many you sell by comparison which in itself might be instructive, and two have it put up on webs sites like this so that you can watch incessant critiques by bloggers of your nature. Have fun.
Bored, you have just committed a sort of backward logical error of appeal to authority. I would encourage you not to be blinded by ideology but to actually be able to step back and assess the quality of the work in question.
Sure, I haven’t published papers or the like. However, I have done some papers on critical data analysis, analysis methods etc. Also, I have used reasonably complicated analysis techniques such as structural equation modelling in my thesis. So, I know enough to be able to criticise this sort of stuff. Notice above that even Puddlegum and the authors themselves concede that the graph I have been criticising in itself is very weak evidence for their argument. So, I am not just blowing hot air.
If I was going to do a study similar to “the spirit level” I wouldn’t bother with all these regression charts. If you have ever used a technique called “multiple regression” you will realise why.
The way I would have done the study would have been to start with a time-series study in one country, such as the US. I would then study the effect of changes in the data for income inequality with subsequent changes in social variables over a thirty year period or such. Doesn’t mean I would have to wait 30 years. Just that I would use historical data. My thesis would be that changes in income inequality would be associated with subsequent changes in social variables. I could then model for goodness of fit to confirm the direction of causation. Demonstrating that the theorised effect occurred after the theorised cause is a good way to rule out “correlation is not causation” arguments.
If that study demonstrated a significant association, I would then test other countries to see if the effect was repeatable in other cultures. If it repeats reliably then the argument would be very strong.
This would provide much more convincing results than what I have seen in the articles to date on “the spirit level”.
So you dont want to write a book BUT you are prepared to write the first chapter in reply to the idea……my goodness you could earn some cash if your prodigious output was saleable. And theres the rub.
What I have proposed as a better method is a very standard way of conducting these sorts of studies. Nothing weird or unusual about it. I am sure that if Puddlegum comes back on line he would agree.
Have you ever done any stat analysis in rhino hides?
No. Have you?
The way I would have done the study would have been to start with a time-series study in one country, such as the US. I would then study the effect of changes in the data for income inequality with subsequent changes in social variables over a thirty year period or such. Doesn’t mean I would have to wait 30 years. Just that I would use historical data.
The experiment had been done.
According to Naomi Klein, in her chapter from “The Shock Doctrine” called “Bonfire of a Young Democracy” (pp. 275-309), in 1989 there were about 2 million Russians living in poverty. Under corporatism (which the press mislabeled “democracy”), by the mid-90s, 74 million Russians lived in poverty. Along the way, addiction, alcoholism, violent crime, and AIDS skyrocketted, and longevity plummetted. Bottom line, the suffering in Russia was horrific, but was passed off in the media as the “growing pains” of the transition to “democracy,” when, in fact, it was an orgy of greed and abuse.
The result of Yeltsin throwing the nation’s assets into a vast fire sale was that around half of Russians finished up living in abject poverty, a much diminshed professional and middle class barely held their heads above water by working two or more jobs or cutting deals in various black markets…while a small elite prospered beyond all belief. The change in income inequality was extreme, and the consequences stark.
No fancy statistics needed.
Start with New Zealand.
Strong correlation between the rise in inequality and many indicators of social decline over the last 50 years, no matter what type of regression you use.
The time based study that TS wants to do confirm the ideas in the Spirit level ,especially over the last 30 years in the USA.
If you want an interesting comparison. Compare Illinois with North Dakota.