 On the distribution of income
Written By:
- Date published:
10:57 am, May 20th, 2008 - 62 comments
Categories: workers' rights -
Tags: minimum wage, pay, tax

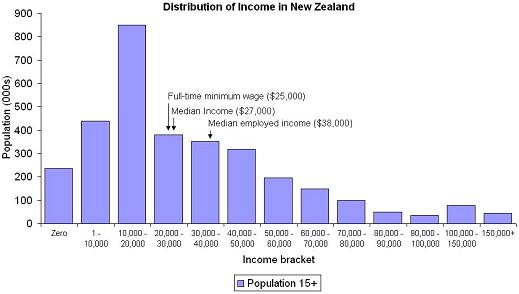
See that line that says minimum wage? Nearly half of kiwis earn less than that.
Seven months ago, that was me. I was working removing asbestos contaminated glue from the floor of an office building along with half a dozen other guys. Now, asbestos is pretty dangerous stuff, inhaling a single thread of it can give you asbestosis, a deadly respiratory disease. So, we had some crappy old masks and some cheap overalls to wear. The areas we worked in were sealed from the outside world and had big fans in them to keep them at low air pressure, so if a leak developed air would flow in and no asbestos threads could get out. The outside temperature was 25 degrees. Inside it was 40 degrees plus and there was no oxygen, as we scraped potentially deadly forty year old glue off the floor. The sweat would pool in your mask but I was afraid to pull it back.
We were effectively day labourers, employed by a labour hire company that contracted our labour (and took $8 an hour as commission from the company); we would be out of a job on the day that the boss decided there was no more work for us (of course, this actually made us work slower because we didn’t want to work ourselves out of a job).
The men I had been working with had been doing jobs like this for years, decades. ‘At least now’, they told me, “we are getting some decent pay” – $11.25 an hour (as was the minimum wage at the time), just eight years before they would have been getting $7.50 an hour and no Working for Families to help them out.
See that $60,000 bracket? Less than 14% of kiwis have incomes higher than that. I’m now one of them. And do I work harder for this great increase in reward? Well, I have a chair, I have a computer, there’s coffee, and air conditioning, I don’t have the risk of contracting asbestosis, damaging my back, or finding my job has simply disappeared, and I get to sit in meetings for hours just letting the conversation wash over me like fresh air, remembering being hardly able to breath in that mask.
So, no, I don’t think this job is harder, and get I paid three times more. I suspect that for most of the people reading this, your working life is more akin to my nice well-paid office job, than that job sweating in a toxin-laden room. It’s very easy in our lives to forget how much better we have it than most.
Every morning, when I get up, I know that I am fortunate. I know that most kiwis have it tougher than I do, I know that my income is good, I know that I am not treated as a disposable automaton by my employer. So, no, I don’t begrudge a government that wants to take a small part of my income to help out those who, because of the nature of our economic system, have it tougher than me and help look after their families.
62 comments on “On the distribution of income ”
- Comments are now closed
Links to post
- Comments are now closed
Recent Comments
- Skeptical Science New Research for Week #18 2024
 Open access notables Generative AI tools can enhance climate literacy but must be checked for biases and inaccuracies, Atkins et al., Communications Earth & Environment: In the face of climate change, climate literacy is becoming increasingly important. With wide access to generative AI tools, such as OpenAI’s ChatGPT, we explore the potential ...5 hours ago
 - Ruckus over AUKUS – Labour demands Peters step down as Foreign Minister, but he still had the job ...
 Buzz from the Beehive Foreign Affairs Minister Winston Peters was bound to win headlines when he set out his thinking about AUKUS in his speech to the New Zealand Institute of International Affairs. The headlines became bigger when – during an interview on RNZ’s Morning Report today – he criticised ...9 hours ago
 - Secrecy undermines participation
 The Post reports on how the government is refusing to release its advice on its corrupt Muldoonist fast-track law, instead using the "soon to be publicly available" refusal ground to hide it until after select committee submissions on the bill have closed. Fast-track Minister Chris Bishop's excuse? “It's not ...9 hours ago
 - Agribusiness following oil and gas playbookAs pressure on it grows, the livestock industry’s approach to the transition to Net Zero is increasingly being compared to that of fossil fuel interests. Photo: Lynn Grieveson / Getty ImagesTL;DR: Here’s the top five news items of note in climate news for Aotearoa-NZ this week, and a discussion above ...9 hours ago
- Here’s hoping they aren’t counting on a 100 per cent acceptance…The New Zealand Herald reports – Stats NZ has offered a voluntary redundancy scheme to all of its workers as a way to give staff some control over their “future” amidst widespread job losses in the public sector. In an update to staff this morning, seen by the Herald, Statistics New Zealand ...12 hours ago
- Gordon Campbell on unemployment, Winston Peters’ low boiling point and music criticism
 On Werewolf/Scoop, I usually do two long form political columns a week. From now on, there will be an extra column each week about music and movies. But first, some late-breaking political events: The rise in unemployment numbers for the March quarter was bigger than expected – and especially sharp ...12 hours ago
 - TVNZ and poll results
 12 hours ago
 - Mana or MoneyMuriel Newman writes – When Meridian Energy was seeking resource consents for a West Coast hydro dam proposal in 2010, local Maori “strenuously” objected, claiming their mana was inextricably linked to ‘their’ river and could be damaged. After receiving a financial payment from the company, however, the Ngai Tahu ...13 hours ago
- Bernard’s pick 'n' mix for Thursday, May 2
 TL;DR: Here’s my top 10 ‘pick ‘n’ mix of links to news, analysis and opinion articles as of 11:10 am on Thursday, May 2:Scoop: Government sits on official advice on fast-track consent. The Ombudsman is investigating after official briefings on the contentious regime were held back despite requests from Forest ...13 hours ago
 - The Art of taking no ResponsibilityAlwyn Poole writes – “An SEP,’ he said, ‘is something that we can’t see, or don’t see, or our brain doesn’t let us see, because we think that it’s somebody else’s problem. That’s what SEP means. Somebody Else’s Problem. The brain just edits it out, it’s like a ...14 hours ago
- The shabby “Parliamentary urgency” ploy – shaky foundations and why our democracy needs trustOur trust in our political institutions is fast eroding, according to a Maxim Institute discussion paper, Shaky Foundations: Why our democracy needs trust. The paper – released today – raises concerns about declining trust in New Zealand’s political institutions and democratic processes, and the role that the overuse of Parliamentary urgency ...14 hours ago
- Jones has made plain he isn’t fond of frogs (not the dim-witted ones, at least) – and now we lea...This article was prepared for publication yesterday. More ministerial announcements have been posted on the government’s official website since it was written. We will report on these later today …. Buzz from the Beehive There we were, thinking the environment is in trouble, when along came Jones. Shane Jones. ...14 hours ago
- Infrastructure & home building slumping on Govt funding freeze
 16 hours ago
 - Brainwashed People Think Everyone Else is Brainwashed
 Hi,I am just going to state something very obvious: American police are fucking crazy.That was a photo gracing the New York Times this morning, showing New York City police “entering Columbia University last night after receiving a request from the school.”Apparently in America, protesting the deaths of tens of thousands ...19 hours ago
 - Peters’ real foreign policy threat is Helen ClarkWinston Peters’ much anticipated foreign policy speech last night was a work of two halves. Much of it was a standard “boilerplate” Foreign Ministry overview of the state of the world. There was some hardening up of rhetoric with talk of “benign” becoming “malign” and old truths giving way to ...20 hours ago
- NZ’s trans lobby is fighting a rearguard action
 Graham Adams assesses the fallout of the Cass Review — The press release last Thursday from the UN Special Rapporteur on violence against women and girls didn’t make the mainstream news in New Zealand but it really should have. The startling title of Reem Alsalem’s statement — “Implementation of ‘Cass ...1 day ago
 - Your mandate is imaginary
 This open-for-business, under-new-management cliché-pockmarked government of Christopher Luxon is not the thing of beauty he imagines it to be. It is not the powerful expression of the will of the people that he asserts it to be. It is not a soaring eagle, it is a malodorous vulture. This newest poll should make ...1 day ago
 - 14,000 unemployed under NationalThe latest labour market statistics, showing a rise in unemployment. There are now 134,000 unemployed - 14,000 more than when the National government took office. Which is I guess what happens when the Reserve Bank causes a recession in an effort to Keep Wages Low. The previous government saw a ...1 day ago
- Bryce Edwards: Discontent and gloom dominate NZ’s political mood
 Three opinion polls have been released in the last two days, all showing that the new government is failing to hold their popular support. The usual honeymoon experienced during the first year of a first term government is entirely absent. The political mood is still gloomy and discontented, mainly due ...1 day ago
 - Taking Tea with 42 & 38.
 National's Finance Minister once met a poor person.A scornful interview with National's finance guru who knows next to nothing about economics or people.There might have been something a bit familiar if that was the headline I’d gone with today. It would of course have been in tribute to the article ...1 day ago
 - Beware political propaganda: statistics are pointing to Grant Robertson never protecting “Lives an...Rob MacCulloch writes – Throughout the pandemic, the new Vice-Chancellor-of-Otago-University-on-$629,000 per annum-Can-you-believe-it-and-Former-Finance-Minister Grant Robertson repeated the mantra over and over that he saved “lives and livelihoods”. As we update how this claim is faring over the course of time, the facts are increasingly speaking differently. NZ ...2 days ago
- Winding back the hands of history’s clockChris Trotter writes – IT’S A COMMONPLACE of political speeches, especially those delivered in acknowledgement of electoral victory: “We’ll govern for all New Zealanders.” On the face of it, the pledge is a strange one. Why would any political leader govern in ways that advantaged the huge ...2 days ago
- Paula Bennett’s political appointment will challenge public confidence
 Bryce Edwards writes – The list of former National Party Ministers being given plum and important roles got longer this week with the appointment of former Deputy Prime Minister Paula Bennett as the chair of Pharmac. The Christopher Luxon-led Government has now made key appointments to Bill ...2 days ago
 - Business confidence sliding into winter of discontentTL;DR: These are the six things that stood out to me in news and commentary on Aotearoa-NZ’s political economy at 10:06am on Wednesday, May 1:The Lead: Business confidence fell across the board in April, falling in some areas to levels last seen during the lockdowns because of a collapse in ...2 days ago
- Gordon Campbell on the coalition’s awful, not good, very bad poll resultsOver the past 36 hours, Christopher Luxon has been dong his best to portray the centre-right’s plummeting poll numbers as a mark of virtue. Allegedly, the negative verdicts are the result of hard economic times, and of a government bravely set out on a perilous rescue mission from which not ...2 days ago
- New HOP readers for future payment options
 Auckland Transport have started rolling out new HOP card readers around the network and over the next three months, all of them on buses, at train stations and ferry wharves will be replaced. The change itself is not that remarkable, with the new readers looking similar to what is already ...2 days ago
 - 2024 Reading Summary: April (+ Writing Update)
 Completed reads for April: The Difference Engine, by William Gibson and Bruce Sterling Carnival of Saints, by George Herman The Snow Spider, by Jenny Nimmo Emlyn’s Moon, by Jenny Nimmo The Chestnut Soldier, by Jenny Nimmo Death Comes As the End, by Agatha Christie Lord of the Flies, by ...2 days ago
 - At a glance – Clearing up misconceptions regarding 'hide the decline'On February 14, 2023 we announced our Rebuttal Update Project. This included an ask for feedback about the added "At a glance" section in the updated basic rebuttal versions. This weekly blog post series highlights this new section of one of the updated basic rebuttal versions and serves as a ...2 days ago
- Road photos
 Have a story to share about St Paul’s, but today just picturesPopular novels written at this desk by a young man who managed to bootstrap himself out of father’s imprisonment and his own young life in a workhouse Read more ...2 days ago
 - Bryce Edwards: Paula Bennett’s political appointment will challenge public confidenceThe list of former National Party Ministers being given plum and important roles got longer this week with the appointment of former Deputy Prime Minister Paula Bennett as the chair of Pharmac. The Christopher Luxon-led Government has now made key appointments to Bill English, Simon Bridges, Steven Joyce, Roger Sowry, ...2 days ago
- NZDF is still hostile to oversightNewsroom has a story today about National's (fortunately failed) effort to disestablish the newly-created Inspector-General of Defence. The creation of this agency was the key recommendation of the Inquiry into Operation Burnham, and a vital means of restoring credibility and social licence to an agency which had been caught lying ...2 days ago
- Winding Back The Hands Of History’s Clock.
 Holding On To The Present: The moment a political movement arises that attacks the whole idea of social progress, and announces its intention to wind back the hands of History’s clock, then democracy, along with its unwritten rules, is in mortal danger.IT’S A COMMONPLACE of political speeches, especially those delivered in ...2 days ago
 - Sweet Moderation? What Christopher Luxon Could Learn From The Germans.2 days ago
- A clear warningThe unpopular coalition government is currently rushing to repeal section 7AA of the Oranga Tamariki Act. The clause is Oranga Tamariki's Treaty clause, and was inserted after its systematic stealing of Māori children became a public scandal and resulted in physical resistance to further abductions. The clause created clear obligations ...2 days ago
- Poll results and Waitangi Tribunal report go unmentioned on the Beehive website – where racing tru...Buzz from the Beehive The government’s official website – which Point of Order monitors daily – not for the first time has nothing much to say today about political happenings that are grabbing media headlines. It makes no mention of the latest 1News-Verian poll, for example. This shows National down ...2 days ago
- Listening To The Traffic.2 days ago
- Comity Be Damned! The State’s Legislative Arm Is Flexing Its Constitutional Muscles.Packing A Punch: The election of the present government, including in its ranks politicians dedicated to reasserting the rights of the legislature in shaping and determining the future of Māori and Pakeha in New Zealand, should have alerted the judiciary – including its anomalous appendage, the Waitangi Tribunal – that its ...2 days ago
- Ending The Quest.Dead Woman Walking: New Zealand’s media industry had been moving steadily towards disaster for all the years Melissa Lee had been National’s media and communications policy spokesperson, and yet, when the crisis finally broke, on her watch, she had nothing intelligent to offer. Christopher Luxon is a patient man - but he’s not ...2 days ago
- Will political polarisation intensify to the point where ‘normal’ government becomes impossible,...Chris Trotter writes – New Zealand politics is remarkably easy-going: dangerously so, one might even say. With the notable exception of John Key’s flat ruling-out of the NZ First Party in 2008, all parties capable of clearing MMP’s five-percent threshold, or winning one or more electorate seats, tend ...3 days ago
- Bernard’s pick 'n' mix for Tuesday, April 30
 TL;DR: Here’s my top 10 ‘pick ‘n’ mix of links to news, analysis and opinion articles as of 10:30am on Tuesday, May 30:Scoop: NZ 'close to the tipping point' of measles epidemic, health experts warn NZ Herald Benjamin PlummerHealth: 'Absurd and totally unacceptable': Man has to wait a year for ...3 days ago
 - Why Tory Whanau has the lowest approval rating in the countryBryce Edwards writes – Polling shows that Wellington Mayor Tory Whanau has the lowest approval rating of any mayor in the country. Siting at -12 per cent, the proportion of constituents who disapprove of her performance outweighs those who give her the thumbs up. This negative rating is ...3 days ago
- Worst poll result for a new Government in MMP history3 days ago
- Pinning down climate change's role in extreme weatherThis is a re-post from The Climate Brink by Andrew Dessler In the wake of any unusual weather event, someone inevitably asks, “Did climate change cause this?” In the most literal sense, that answer is almost always no. Climate change is never the sole cause of hurricanes, heat waves, droughts, or ...3 days ago
- Serving at Seymour's pleasure.
 Something odd happened yesterday, and I’d love to know if there’s more to it. If there was something which preempted what happened, or if it was simply a throwaway line in response to a journalist.Yesterday David Seymour was asked at a press conference what the process would be if the ...3 days ago
 - Webworm LA Pop-Up
 Hi,From time to time, I want to bring Webworm into the real world. We did it last year with the Jurassic Park event in New Zealand — which was a lot of fun!And so on Saturday May 11th, in Los Angeles, I am hosting a lil’ Webworm pop-up! I’ve been ...3 days ago
 - “Feel good” school is outEducation Minister Erica Standford yesterday unveiled a fundamental reform of the way our school pupils are taught. She would not exactly say so, but she is all but dismantling the so-called “inquiry” “feel good” method of teaching, which has ruled in our classrooms since a major review of the New ...3 days ago
- 6 Months in, surely our Report Card is “Ignored all warnings: recommend dismissal ASAP”?
 Exactly where are we seriously going with this government and its policies? That is, apart from following what may as well be a Truss-Lite approach on the purported economic “plan“, and Victorian-era regression when it comes to social policy. Oh it’ll work this time of course, we’re basically assured, “the ...3 days ago
 - Bread, and how it gets buttered
 Hey Uncle Dave, When the Poms joined the EEC, I wasn't one of those defeatists who said, Well, that’s it for the dairy job. And I was right, eh? The Chinese can’t get enough of our milk powder and eventually, the Poms came to their senses and backed up the ute ...3 days ago
 - Bryce Edwards: Why Tory Whanau has the lowest approval rating in the countryPolling shows that Wellington Mayor Tory Whanau has the lowest approval rating of any mayor in the country. Siting at -12 per cent, the proportion of constituents who disapprove of her performance outweighs those who give her the thumbs up. This negative rating is higher than for any other mayor ...3 days ago
- Justice for Gaza?The New York Times reports that the International Criminal Court is about to issue arrest warrants for Israeli officials, including Prime Minister Benjamin Netanyahu, over their genocide in Gaza: Israeli officials increasingly believe that the International Criminal Court is preparing to issue arrest warrants for senior government officials on ...3 days ago
- If there has been any fiddling with Pharmac’s funding, we can count on Paula to figure out the fis...Buzz from the Beehive Pharmac has been given a financial transfusion and a new chair to oversee its spending in the pharmaceutical business. Associate Health Minister David Seymour described the funding for Pharmac as “its largest ever budget of $6.294 billion over four years, fixing a $1.774 billion fiscal cliff”. ...3 days ago
- FastTrackWatch – The case for the Government’s Fast Track BillBryce Edwards writes – Many criticisms are being made of the Government’s Fast Track Approvals Bill, including by this writer. But as with everything in politics, every story has two sides, and both deserve attention. It’s important to understand what the Government is trying to achieve and its ...4 days ago
- Bernard’s pick 'n' mix for Monday, April 29
 TL;DR: Here’s my top 10 ‘pick ‘n’ mix of links to news, analysis and opinion articles as of 10:10am on Monday, April 29:Scoop: The children's ward at Rotorua Hospital will be missing a third of its beds as winter hits because Te Whatu Ora halted an upgrade partway through to ...4 days ago
 - Gordon Campbell on Iran killing its rappers, and searching for the invisible Dr. Retispan class=”dropcap”>As hideous as David Seymour can be, it is worth keeping in mind occasionally that there are even worse political figures (and regimes) out there. Iran for instance, is about to execute the country’s leading hip hop musician Toomaj Salehi, for writing and performing raps that “corrupt” the nation’s ...4 days ago
- Auckland Rail Electrification 10 years oldYesterday marked 10 years since the first electric train carried passengers in Auckland so it’s a good time to look back at it and the impact it has had. A brief history The first proposals for rail electrification in Auckland came in the 1920’s alongside the plans for earlier ...4 days ago
- Coalition's dirge of austerity and uncertainty is driving the economy into a deeper recession4 days ago
- Disability Funding or Tax Cuts.
 You make people evil to punish the paststuck inside a sequel with a rotating castThe following photos haven’t been generated with AI, or modified in any way. They are flesh and blood, human beings. On the left is Galatea Young, a young mum, and her daughter Fiadh who has Angelman ...4 days ago
 - Of the Goodness of Tolkien’s Eru
 April has been a quiet month at A Phuulish Fellow. I have had an exceptionally good reading month, and a decently productive writing month – for original fiction, anyway – but not much has caught my eye that suggested a blog article. It has been vaguely frustrating, to be honest. ...4 days ago
 - 2024 SkS Weekly Climate Change & Global Warming News Roundup #17A listing of 31 news and opinion articles we found interesting and shared on social media during the past week: Sun, April 21, 2024 thru Sat, April 27, 2024. Story of the week Anthropogenic climate change may be the ultimate shaggy dog story— but with a twist, because here ...4 days ago
- Pastor Who Abused People, Blames People
 Hi,I spent about a year on Webworm reporting on an abusive megachurch called Arise, and it made me want to stab my eyes out with a fork.I don’t regret that reporting in 2022 and 2023 — I am proud of it — but it made me angry.Over three main stories ...4 days ago
 - Vic Uni shows how under threat free speech isThe new Victoria University Vice-Chancellor decided to have a forum at the university about free speech and academic freedom as it is obviously a topical issue, and the Government is looking at legislating some carrots or sticks for universities to uphold their obligations under the Education and Training Act. They ...5 days ago
- Winston remembers Gettysburg.
 Do you remember when Melania Trump got caught out using a speech that sounded awfully like one Michelle Obama had given? Uncannily so.Well it turns out that Abraham Lincoln is to Winston Peters as Michelle was to Melania. With the ANZAC speech Uncle Winston gave at Gallipoli having much in ...5 days ago
 - 25
 She was born 25 years ago today in North Shore hospital. Her eyes were closed tightly shut, her mouth was silently moving. The whole theatre was all quiet intensity as they marked her a 2 on the APGAR test. A one-minute eternity later, she was an 8. The universe was ...5 days ago
 - Fact Brief – Is Antarctica gaining land ice?Skeptical Science is partnering with Gigafact to produce fact briefs — bite-sized fact checks of trending claims. This fact brief was written by Sue Bin Park in collaboration with members from our Skeptical Science team. You can submit claims you think need checking via the tipline. Is Antarctica gaining land ice? ...5 days ago
- Policing protests.
 Images of US students (and others) protesting and setting up tent cities on US university campuses have been broadcast world wide and clearly demonstrate the growing rifts in US society caused by US policy toward Israel and Israel’s prosecution of … Continue reading ...5 days ago
 - Open letter to Hon Paul GoldsmithBarrie Saunders writes – Dear Paul As the new Minister of Media and Communications, you will be inundated with heaps of free advice and special pleading, all in the national interest of course. For what it’s worth here is my assessment: Traditional broadcasting free to air content through ...5 days ago
- Bryce Edwards: FastTrackWatch – The Case for the Government’s Fast Track BillMany criticisms are being made of the Government’s Fast Track Approvals Bill, including by this writer. But as with everything in politics, every story has two sides, and both deserve attention. It’s important to understand what the Government is trying to achieve and its arguments for such a bold reform. ...5 days ago
- Luxon gets out his butcher’s knife – brieflyPeter Dunne writes – The great nineteenth British Prime Minister, William Gladstone, once observed that “the first essential for a Prime Minister is to be a good butcher.” When a later British Prime Minister, Harold Macmillan, sacked a third of his Cabinet in July 1962, in what became ...6 days ago
- More tax for lessEle Ludemann writes – New Zealanders had the OECD’s second highest tax increase last year: New Zealanders faced the second-biggest tax raises in the developed world last year, the Organisation for Economic Cooperation and Development (OECD) says. The intergovernmental agency said the average change in personal income tax ...6 days ago
- Real News vs Fake News.
 We all know something’s not right with our elections. The spread of misinformation, people being targeted with soundbites and emotional triggers that ignore the facts, even the truth, and influence their votes.The use of technology to produce deep fakes. How can you tell if something is real or not? Can ...6 days ago
 - Another way to roll
 Hello! Here comes the Saturday edition of More Than A Feilding, catching you up on the past week’s editions.Share ...6 days ago
 - Simon Clark: The climate lies you'll hear this yearThis video includes conclusions of the creator climate scientist Dr. Simon Clark. It is presented to our readers as an informed perspective. Please see video description for references (if any). This year you will be lied to! Simon Clark helps prebunk some misleading statements you'll hear about climate. The video includes ...6 days ago
- Cutting the Public Service
 It is all very well cutting the backrooms of public agencies but it may compromise the frontlines. One of the frustrations of the Productivity Commission’s 2017 review of universities is that while it observed that their non-academic staff were increasing faster than their academic staff, it did not bother to ...6 days ago
 - Luxon’s demoted ministers might take comfort from the British politician who bounced back after th...Buzz from the Beehive Two speeches delivered by Foreign Affairs Minister Winston Peters at Anzac Day ceremonies in Turkey are the only new posts on the government’s official website since the PM announced his Cabinet shake-up. In one of the speeches, Peters stated the obvious: we live in a troubled ...6 days ago
- This is how I roll over
 1. Which of these would you not expect to read in The Waikato Invader?a. Luxon is here to do business, don’t you worry about thatb. Mr KPI expects results, and you better believe itc. This decisive man of action is getting me all hot and excitedd. Melissa Lee is how ...6 days ago
- Release: National gaslights women fighting for equal pay
 National has scrapped the pay equity taskforce that fights for equal pay for women and looks at ethnic pay gaps. ...7 hours ago
 - Release: More job cuts, fewer houses under NationalThe Government is again adding to New Zealand’s growing unemployment, this time cutting jobs at the agencies responsible for urban development and growing much needed housing stock. ...8 hours ago
- Release: Children fall deeper through the cracks in Govt cutsWith Minister Karen Chhour indicating in the House today that she either doesn’t know or care about the frontline cuts she’s making to Oranga Tamariki, we risk seeing more and more of our children falling through the cracks. ...9 hours ago
- Release: Labour honours memory of Sir Robert MartinThe Labour Party is saddened to learn of the death of Sir Robert Martin, a globally renowned disability advocate who led the way for disability rights both in New Zealand and internationally. ...16 hours ago
- Release: 130,000 cattle saved from live exportLabour is calling for the Government to urgently rethink its coalition commitment to restart live animal exports, Labour animal welfare spokesperson Rachel Boyack said. ...1 day ago
- Central Bank makes clear Government is pouring fuel on housing crisis fire
 Today’s Financial Stability Report has once again highlighted that poverty and deep inequality are political choices - and this Government is choosing to make them worse. ...1 day ago
 - New unemployment figures paint bleak pictureThe Green Party is calling on the Government to do more for our households in most need as unemployment rises and the cost of living crisis endures. ...2 days ago
- Release: National’s job cuts already starting to bite as unemployment risesUnemployment is on the rise and it’s only going to get worse under this Government, Labour finance spokesperson Barbara Edmonds said. Stats NZ figures show the unemployment rate grew to 4.3 percent in the March quarter from 4 percent in the December quarter. “This is the second rise in unemployment ...2 days ago
- Release: National hiking transport costs for families and young New ZealandersWeekly expenses will grow for more than 1.6 million New Zealanders as the Government ends free and half price public transport fares tomorrow. ...2 days ago
- Release: Labour welcomes EU free trade agreementThe New Zealand Labour Party welcomes the entering into force of the European Union and New Zealand free trade agreement. This agreement opens the door for a huge increase in trade opportunities with a market of 450 million people who are high value discerning consumers of New Zealand goods and ...2 days ago
- Surprise: Landlord tax cuts don’t trickle downThe Green Party is renewing its call for rent controls following reports of rental prices hitting an all-time high. ...3 days ago
- Release: $1.7b for no increase in access to medicineThe National-led Government continues its fiscal jiggery pokery with its Pharmac announcement today, Labour Health spokesperson Ayesha Verrall says. “The government has increased Pharmac funding but conceded it will only make minimal increases in access to medicine”, said Ayesha Verrall “This is far from the bold promises made to fund ...3 days ago
- Release: National should heed Tribunal warning and scrap coalition commitment with ACTThis afternoon’s interim Waitangi Tribunal report must be taken seriously as it affects our most vulnerable children, Labour children’s spokesperson Willow-Jean Prime. ...3 days ago
- Release: More accountability for preventable workplace deaths this Workers’ Memorial DayLabour is calling for more accountability for preventable workplace deaths because everybody who goes to work deserves to come home safely. ...4 days ago
- Gaza: Aotearoa Must Support Independent Investigation into Mass GravesTe Pāti Māori are demanding the New Zealand Government support an international independent investigation into mass graves that have been uncovered at two hospitals on the Gaza strip, following weeks of assault by Israeli troops. Among the 392 bodies that have been recovered, are children and elderly civilians. Many of ...6 days ago
- Release: Working together on consistent support for veterans this Anzac DayOur two-tiered system for veterans’ support is out of step with our closest partners, and all parties in Parliament should work together to fix it, Labour veterans’ affairs spokesperson Greg O’Connor said. ...1 week ago
- Release: Penny drops – but what about Seymour and Peters?Stripping two Ministers of their portfolios just six months into the job shows Christopher Luxon’s management style is lacking, Labour Leader Chris Hipkins said. ...1 week ago
- Another ‘Stolen Generation’ enabled by court ruling on Waitangi Tribunal summonsTonight’s court decision to overturn the summons of the Children’s Minister has enabled the Crown to continue making decisions about Māori without evidence, says Te Pāti Māori spokesperson for Children, Mariameno Kapa-Kingi. “The judicial system has this evening told the nation that this government can do whatever they want when ...1 week ago
- Release: Budget blunder shows Nicola Willis could cut recovery fundingIt appears Nicola Willis is about to pull the rug out from under the feet of local communities still dealing with the aftermath of last year’s severe weather, and local councils relying on funding to build back from these disasters. ...1 week ago
- Further environmental mismanagement on the cardsThe Government’s resource management reforms will add to the heavy and ever-growing burden this Government is loading on to our environment. ...1 week ago
- Release: RMA changes will be a disaster for environmentThe Government is making short-sighted changes to the Resource Management Act (RMA) that will take away environmental protection in favour of short-term profits, Labour’s environment spokesperson Rachel Brooking said today. ...1 week ago
- Release: Labour supports urgent changes to emergency management systemLabour welcomes the release of the report into the North Island weather events and looks forward to working with the Government to ensure that New Zealand is as prepared as it can be for the next natural disaster. ...1 week ago
- Release: Labour calls for New Zealand to recognise PalestineThe Labour Party has called for the New Zealand Government to recognise Palestine, as a material step towards progressing the two-State solution needed to achieve a lasting peace in the region. ...1 week ago
- Release: Three strikes law political posturing of worst kindThe Government is bringing back a law that has little evidential backing just to look tough, Labour justice spokesperson Duncan Webb said. ...1 week ago
- Release: Government cuts unbelievably target child exploitation, violent extremism, ports and airpor...Some of our country’s most important work, stopping the sexual exploitation of children and violent extremism could go along with staff on the frontline at ports and airports. ...1 week ago
- Three strikes has failed before and will fail againResurrecting the archaic three-strikes legislation is an unwelcome return to a failed American-style approach to justice. ...1 week ago
- Release: Environmental protection vital, not ‘onerous’The Government’s Fast Track Approvals Bill will give projects such as new coal mines a ‘get out of jail free’ card to wreak havoc on the environment, Labour Leader Chris Hipkins said today. ...2 weeks ago
- Ferris – Three Strikes targets those ‘too brown to be white’The government's decision to reintroduce Three Strikes is a destructive and ineffective piece of law-making that will only exacerbate an inherently biased and racist criminal justice system, said Te Pāti Māori Justice Spokesperson, Tākuta Ferris, today. During the time Three Strikes was in place in Aotearoa, Māori and Pasifika received ...2 weeks ago
- Release: Govt cuts doctors and nurses in hiring freezeCuts to frontline hospital staff are not only a broken election promise, it shows the reckless tax cuts have well and truly hit the frontline of the health system, says Labour Health spokesperson Ayesha Verrall. ...2 weeks ago
- Fast-track submissions period must be extendedThe Green Party has joined the call for public submissions on the fast-track legislation to be extended after the Ombudsman forced the Government to release the list of organisations invited to apply just hours before submissions close. ...2 weeks ago
- Release: Progress on climate will be undone by GovtNew Zealand’s good work at reducing climate emissions for three years in a row will be undone by the National government’s lack of ambition and scrapping programmes that were making a difference, Labour Party climate spokesperson Megan Woods said today. ...2 weeks ago
- Release: Dark day for Kiwi kids as a third of Govt cuts affect themNews that 1000 jobs at the Ministry of Education and Oranga Tamariki could go is devastating for future generations of New Zealanders. ...2 weeks ago
- Release: Alarm as Government signals further blow to school lunchesMore essential jobs could be on the chopping block, this time Ministry of Education staff on the school lunches team are set to find out whether they're in line to lose their jobs. ...2 weeks ago
- Oranga Tamariki cuts commit tamariki to state abuseTe Pāti Māori is disgusted at the confirmation that hundreds are set to lose their jobs at Oranga Tamariki, and the disestablishment of the Treaty Response Unit. “This act of absolute carelessness and out of touch decision making is committing tamariki to state abuse.” Said Te Pāti Māori Oranga Tamariki ...2 weeks ago
- Release: Quick, submit – stop Govt’s dodgy approvals billThe Government is trying to bring in a law that will allow Ministers to cut corners and kill off native species, Labour environment spokesperson Rachel Brooking said. ...2 weeks ago
- Government throws coal on the climate crisis fireThe Government’s policy announced today to ease consenting for coal mining will have a lasting impact across generations. ...2 weeks ago
- Release: Public transport costs to double as National looks at unaffordable roading project insteadCancelling urgently needed new Cook Strait ferries and hiking the cost of public transport for many Kiwis so that National can announce the prospect of another tunnel for Wellington is not making good choices, Labour Transport Spokesperson Tangi Utikere said. ...2 weeks ago
- Release: Cost of living in Auckland still not a priorityA laundry list of additional costs for Tāmaki Makarau Auckland shows the Minister for the city is not delivering for the people who live there, says Labour Auckland Issues spokesperson Shanan Halbert. ...3 weeks ago
- Te Pāti Māori to visit Queensland to strengthen ties with Māori in AustraliaTe Pāti Māori co-leader Rawiri Waititi, and Mema Paremata mō Tāmaki-Makaurau, Takutai Tarsh Kemp, will travel to the Gold Coast to strengthen ties with Māori in Australia next week (15-21 April). The visit, in the lead-up to the 9th Australian National Kapa haka Festival, will be an opportunity for both ...3 weeks ago
- Modern insurance law will protect Kiwi households
 The Government is modernising insurance law to better protect Kiwis and provide security in the event of a disaster, Commerce and Consumer Affairs Minister Andrew Bayly announced today. “These reforms are long overdue. New Zealand’s insurance law is complicated and dated, some of which is more than 100 years old. ...7 hours ago
 - Government recommits to equal payThe coalition Government is refreshing its approach to supporting pay equity claims as time-limited funding for the Pay Equity Taskforce comes to an end, Public Service Minister Nicola Willis says. “Three years ago, the then-government introduced changes to the Equal Pay Act to support pay equity bargaining. The changes were ...10 hours ago
- Transforming how our children learn to readStructured literacy will change the way New Zealand children learn to read - improving achievement and setting students up for success, Education Minister Erica Stanford says. “Being able to read and write is a fundamental life skill that too many young people are missing out on. Recent data shows that ...11 hours ago
- NZ not backing down in Canada dairy disputeTrade Minister Todd McClay says Canada’s refusal to comply in full with a CPTPP trade dispute ruling in our favour over dairy trade is cynical and New Zealand has no intention of backing down. Mr McClay said he has asked for urgent legal advice in respect of our ‘next move’ ...13 hours ago
- Stronger oversight for our most vulnerable childrenThe rights of our children and young people will be enhanced by changes the coalition Government will make to strengthen oversight of the Oranga Tamariki system, including restoring a single Children’s Commissioner. “The Government is committed to delivering better public services that care for our most at-risk young people and ...15 hours ago
- Streamlining Building Consent ChangesThe Government is making it easier for minor changes to be made to a building consent so building a home is easier and more affordable, Building and Construction Minister Chris Penk says. “The coalition Government is focused on making it easier and cheaper to build homes so we can ...20 hours ago
- Minister acknowledges passing of Sir Robert Martin (KNZM)New Zealand lost a true legend when internationally renowned disability advocate Sir Robert Martin (KNZM) passed away at his home in Whanganui last night, Disabilities Issues Minister Louise Upston says. “Our Government’s thoughts are with his wife Lynda, family and community, those he has worked with, the disability community in ...1 day ago
- Speech to New Zealand Institute of International Affairs, Parliament – Annual Lecture: Challenges ...Good evening – Before discussing the challenges and opportunities facing New Zealand’s foreign policy, we’d like to first acknowledge the New Zealand Institute of International Affairs. You have contributed to debates about New Zealand foreign policy over a long period of time, and we thank you for hosting us. ...1 day ago
- Accelerating airport security linesFrom today, passengers travelling internationally from Auckland Airport will be able to keep laptops and liquids in their carry-on bags for security screening thanks to new technology, Transport Minister Simeon Brown says. “Creating a more efficient and seamless travel experience is important for holidaymakers and businesses, enabling faster movement through ...1 day ago
- Community hui to talk about kina barrensPeople with an interest in the health of Northland’s marine ecosystems are invited to a public meeting to discuss how to deal with kina barrens, Oceans and Fisheries Minister Shane Jones says. Mr Jones will lead the discussion, which will take place on Friday, 10 May, at Awanui Hotel in ...2 days ago
- Kiwi exporters win as NZ-EU FTA enters into forceKiwi exporters are $100 million better off today with the NZ EU FTA entering into force says Trade Minister Todd McClay. “This is all part of our plan to grow the economy. New Zealand's prosperity depends on international trade, making up 60 per cent of the country’s total economic activity. ...2 days ago
- Mining resurgence a welcome signThere are heartening signs that the extractive sector is once again becoming an attractive prospect for investors and a source of economic prosperity for New Zealand, Resources Minister Shane Jones says. “The beginnings of a resurgence in extractive industries are apparent in media reports of the sector in the past ...2 days ago
- Ō-Rākau Remembrance Bill passes first readingThe return of the historic Ō-Rākau battle site to the descendants of those who fought there moved one step closer today with the first reading of Te Pire mō Ō-Rākau, Te Pae o Maumahara / The Ō-Rākau Remembrance Bill. The Bill will entrust the 9.7-hectare battle site, five kilometres west ...2 days ago
- Government to boost public EV charging networkEnergy Minister Simeon Brown has announced 25 new high-speed EV charging hubs along key routes between major urban centres and outlined the Government’s plan to supercharge New Zealand’s EV infrastructure. The hubs will each have several chargers and be capable of charging at least four – and up to 10 ...2 days ago
- Residential Property Managers Bill to not progressThe coalition Government will not proceed with the previous Government’s plans to regulate residential property managers, Housing Minister Chris Bishop says. “I have written to the Chairperson of the Social Services and Community Committee to inform him that the Government does not intend to support the Residential Property Managers Bill ...2 days ago
- Independent review into disability support servicesThe Government has announced an independent review into the disability support system funded by the Ministry of Disabled People – Whaikaha. Disability Issues Minister Louise Upston says the review will look at what can be done to strengthen the long-term sustainability of Disability Support Services to provide disabled people and ...3 days ago
- Justice Minister updates UN on law & order planJustice Minister Paul Goldsmith has attended the Universal Periodic Review in Geneva and outlined the Government’s plan to restore law and order. “Speaking to the United Nations Human Rights Council provided us with an opportunity to present New Zealand’s human rights progress, priorities, and challenges, while responding to issues and ...3 days ago
- Ending emergency housing motels in RotoruaThe Government and Rotorua Lakes Council are committed to working closely together to end the use of contracted emergency housing motels in Rotorua. Associate Minister of Housing (Social Housing) Tama Potaka says the Government remains committed to ending the long-term use of contracted emergency housing motels in Rotorua by the ...3 days ago
- Trade Minister travels to Riyadh, OECD, and DubaiTrade Minister Todd McClay heads overseas today for high-level trade talks in the Gulf region, and a key OECD meeting in Paris. Mr McClay will travel to Riyadh to meet with counterparts from Saudi Arabia and the Gulf Cooperation Council (GCC). “New Zealand’s goods and services exports to the Gulf region ...3 days ago
- Education priorities focused on lifting achievementEducation Minister Erica Stanford has outlined six education priorities to deliver a world-leading education system that sets Kiwi kids up for future success. “I’m putting ambition, achievement and outcomes at the heart of our education system. I want every child to be inspired and engaged in their learning so they ...3 days ago
- NZTA App first step towards digital driver licenceThe new NZ Transport Agency (NZTA) App is a secure ‘one stop shop’ to provide the services drivers need, Transport Minister Simeon Brown and Digitising Government Minister Judith Collins say. “The NZTA App will enable an easier way for Kiwis to pay for Vehicle Registration and Road User Charges (RUC). ...3 days ago
- Supporting whānau out of emergency housingWhānau with tamariki growing up in emergency housing motels will be prioritised for social housing starting this week, says Associate Housing Minister Tama Potaka. “Giving these whānau a better opportunity to build healthy stable lives for themselves and future generations is an essential part of the Government’s goal of reducing ...3 days ago
- Tribute to Dave O'SullivanRacing Minister Winston Peters has paid tribute to an icon of the industry with the recent passing of Dave O’Sullivan (OBE). “Our sympathies are with the O’Sullivan family with the sad news of Dave O’Sullivan’s recent passing,” Mr Peters says. “His contribution to racing, initially as a jockey and then ...3 days ago
- Speech – Eid al-FitrAssalaamu alaikum, greetings to you all. Eid Mubarak, everyone! I want to extend my warmest wishes to you and everyone celebrating this joyous occasion. It is a pleasure to be here. I have enjoyed Eid celebrations at Parliament before, but this is my first time joining you as the Minister ...4 days ago
- Government saves access to medicinesAssociate Health Minister David Seymour has announced Pharmac’s largest ever budget of $6.294 billion over four years, fixing a $1.774 billion fiscal cliff. “Access to medicines is a crucial part of many Kiwis’ lives. We’ve committed to a budget allocation of $1.774 billion over four years so Kiwis are ...4 days ago
- Pharmac Chair appointedHon Paula Bennett has been appointed as member and chair of the Pharmac board, Associate Health Minister David Seymour announced today. "Pharmac is a critical part of New Zealand's health system and plays a significant role in ensuring that Kiwis have the best possible access to medicines,” says Mr Seymour. ...5 days ago
- Taking action on Fetal Alcohol Spectrum DisorderHundreds of New Zealand families affected by Fetal Alcohol Spectrum Disorder (FASD) will benefit from a new Government focus on prevention and treatment, says Health Minister Dr Shane Reti. “We know FASD is a leading cause of preventable intellectual and neurodevelopmental disability in New Zealand,” Dr Reti says. “Every day, ...6 days ago
- New sports complex opens in KaikoheRegional Development Minister Shane Jones today attended the official opening of Kaikohe’s new $14.7 million sports complex. “The completion of the Kaikohe Multi Sports Complex is a fantastic achievement for the Far North,” Mr Jones says. “This facility not only fulfils a long-held dream for local athletes, but also creates ...6 days ago
- Diplomacy needed more than everForeign Minister Winston Peters’ engagements in Türkiye this week underlined the importance of diplomacy to meet growing global challenges. “Returning to the Gallipoli Peninsula to represent New Zealand at Anzac commemorations was a sombre reminder of the critical importance of diplomacy for de-escalating conflicts and easing tensions,” Mr Peters ...6 days ago
- Anzac Commemorative Address, Buttes New British Cemetery BelgiumAmbassador Millar, Burgemeester, Vandepitte, Excellencies, military representatives, distinguished guests, ladies and gentlemen – good morning and welcome to this sacred Anzac Day dawn service. It is an honour to be here on behalf of the Government and people of New Zealand at Buttes New British Cemetery, Polygon Wood – a deeply ...6 days ago
- Anzac Commemorative Address – NZ National Service, Chunuk BairDistinguished guests - It is an honour to return once again to this site which, as the resting place for so many of our war-dead, has become a sacred place for generations of New Zealanders. Our presence here and at the other special spaces of Gallipoli is made ...1 week ago
- Anzac Commemorative Address – Dawn Service, Gallipoli, TürkiyeMai ia tawhiti pamamao, te moana nui a Kiwa, kua tae whakaiti mai matou, ki to koutou papa whenua. No koutou te tapuwae, no matou te tapuwae, kua honoa pumautia. Ko nga toa kua hinga nei, o te Waipounamu, o te Ika a Maui, he okioki tahi me o ...1 week ago
- PM announces changes to portfoliosPaul Goldsmith will take on responsibility for the Media and Communications portfolio, while Louise Upston will pick up the Disability Issues portfolio, Prime Minister Christopher Luxon announced today. “Our Government is relentlessly focused on getting New Zealand back on track. As issues change in prominence, I plan to adjust Ministerial ...1 week ago
- New catch limits for unique fishery areasRecreational catch limits will be reduced in areas of Fiordland and the Chatham Islands to help keep those fisheries healthy and sustainable, Oceans and Fisheries Minister Shane Jones says. The lower recreational daily catch limits for a range of finfish and shellfish species caught in the Fiordland Marine Area and ...1 week ago
- Minister welcomes hydrogen milestoneEnergy Minister Simeon Brown has welcomed an important milestone in New Zealand’s hydrogen future, with the opening of the country’s first network of hydrogen refuelling stations in Wiri. “I want to congratulate the team at Hiringa Energy and its partners K one W one (K1W1), Mitsui & Co New Zealand ...1 week ago
- Urgent changes to system through first RMA Amendment BillThe coalition Government is delivering on its commitment to improve resource management laws and give greater certainty to consent applicants, with a Bill to amend the Resource Management Act (RMA) expected to be introduced to Parliament next month. RMA Reform Minister Chris Bishop has today outlined the first RMA Amendment ...1 week ago
- Overseas decommissioning models consideredOverseas models for regulating the oil and gas sector, including their decommissioning regimes, are being carefully scrutinised as a potential template for New Zealand’s own sector, Resources Minister Shane Jones says. The Coalition Government is focused on rebuilding investor confidence in New Zealand’s energy sector as it looks to strengthen ...1 week ago
- Release of North Island Severe Weather Event InquiryEmergency Management and Recovery Minister Mark Mitchell has today released the Report of the Government Inquiry into the response to the North Island Severe Weather Events. “The report shows that New Zealand’s emergency management system is not fit-for-purpose and there are some significant gaps we need to address,” Mr Mitchell ...1 week ago
- Justice Minister to attend Human Rights CouncilJustice Minister Paul Goldsmith is today travelling to Europe where he’ll update the United Nations Human Rights Council on the Government’s work to restore law and order. “Attending the Universal Periodic Review in Geneva provides us with an opportunity to present New Zealand’s human rights progress, priorities, and challenges, while ...1 week ago
- Patterson reopens world’s largest wool scouring facilityAssociate Agriculture Minister, Mark Patterson, formally reopened the world’s largest wool processing facility today in Awatoto, Napier, following a $50 million rebuild and refurbishment project. “The reopening of this facility will significantly lift the economic opportunities available to New Zealand’s wool sector, which already accounts for 20 per cent of ...1 week ago
- OPM’s Bomanak accuses UN of failing to uphold decolonisation role over West Papua
 Asia Pacific Report A West Papuan resistance leader has condemned the United Nations role in allowing Indonesia to “integrate” the Melanesian Pacific region in what is claimed to be an “egregious act of inhumanity” on 1 May 1963. In an open letter to UN Secretary-General António Guterres, Organisasi Papua Merdeka-OPM ...35 mins ago
 - Grattan on Friday: O’Neil and Giles dodge the spotlight shining on blunders over ex-detaineesSource: The Conversation (Au and NZ) – By Michelle Grattan, Professorial Fellow, University of Canberra A key part of the Albanese government’s political strategy is to fill the news cycle with its presence and messaging. Ministers are deployed to the maximum, even when they’ve little to say. This week ...1 hour ago
- Bob Carr confirms intention to launch legal action against Winston Peters
 Carr has confirmed his lawyers have written to Peters, informing him they intend to launch legal action against him. ...2 hours ago
 - A lot to learn from kura kaupapa Māori – Education MinisterDespite low literacy rates in mainstream schools amongst Māori, the results are the complete opposite in kura kaupapa, Stanford says. ...3 hours ago
- Julie Anne Genter: Greens had 'no prior knowledge' of fresh complaint against MPA florist says she felt intimidated during a heated exchange with the MP. ...4 hours ago
- Insurance law overhaul passes first readingRecent extreme weather events showed the importance of a well-functioning insurance system, says Commerce and Consumer Affairs minister Andrew Bayly. ...4 hours ago
- NZ Foreign Minister Peters accused of ‘entirely defamatory’ remarks about ex-Australian ministerBy Jo Moir, RNZ News political editor, and Craig McCulloch, deputy political editor New Zealand’s Labour Party is demanding Winston Peters be stood down as Foreign Minister for opening up the government to legal action over his “totally unacceptable” attack on a prominent AUKUS critic. In an interview on RNZ’s ...5 hours ago
- How much time should you spend sitting versus standing? New research reveals the perfect mix for opt...Source: The Conversation (Au and NZ) – By Christian Brakenridge, Postdoctoral research fellow at Swinburne University, Centre for Urban Transitions, Baker Heart and Diabetes Institute The Conversation, Gorodenkoff/Shutterstock People have a pretty intuitive sense of what is healthy – standing is better than sitting, exercise is great for overall ...5 hours ago
- Into The Deep End – Karori Lifeguard Up For Challenge As Reserve Force Soldier
 The Wellington-based Reserve Force soldier is now almost three years into his New Zealand Army career with 5th/7th Battalion, Royal New Zealand Infantry Regiment. ...5 hours ago
 - Brazilian couple's residency case taken up by minister after advisor forgets to apply for visaAfter multiple pleas and petition, an Auckland couple's residency case is being looked at by the Associate Minister of Immigration. ...5 hours ago
- Fast Track Approvals Bill: None from first day of hearings support bill in current formNone of the groups that spoke to Parliament's environment committee on Thursday supported the bill as it stands. ...6 hours ago
- Australia will trial ‘age assurance’ tech to bar children from online porn. What is it and will ...Source: The Conversation (Au and NZ) – By Paul Haskell-Dowland, Professor of Cyber Security Practice, Edith Cowan University Daniel Jedzura/Shutterstock Responding to a resurgence in gender-based violence and deaths in Australia, the National Cabinet has committed almost A$1 billion to a range of strategies. Tackling “online harms” was among the ...6 hours ago
- Government Cuts Put 130 Jobs On The Line At Kāinga Ora, And 40 At HUD"The Government needs to release the review immediately as this reckless approach to change risks disjointed decision making and creates more distress and uncertainty for staff," Fitzsimons said. ...7 hours ago
- Jeremiah Manele is new Solomon Islands PM with ‘100 day plan’By Koroi Hawkins, RNZ Pacific editor Jeremiah Manele has been elected Prime Minister of Solomon Islands, polling 31 votes to 18 over rival candidate and former opposition leader Mathew Wale with one abstention. The final result of the election by secret ballot was announced by the Governor-General, Sir David Vunagi, ...7 hours ago
- Will Solomon Islands’ new leader stay close to China?Source: The Conversation (Au and NZ) – By Priestley Habru, PhD candidate, public diplomacy, University of Adelaide Former foreign minister Jeremiah Manele has been elected the next prime minister of Solomon Islands, defeating the opposition leader, Matthew Wale, in a vote in parliament. The result is a mixed bag for ...8 hours ago
- A clock in the rocks: what cosmic rays tell us about Earth’s changing surface and climateSource: The Conversation (Au and NZ) – By Shaun Eaves, Senior Lecturer in Physical Geography, Te Herenga Waka — Victoria University of Wellington Jamey Stutz, CC BY-SA How often do mountains collapse, volcanoes erupt or ice sheets melt? For Earth scientists, these are important questions as we try ...10 hours ago
- Watch: PM's pre-Budget education announcement for teaching readingFrom next year, the government expects all public schools to take a "proven structured literacy approach". ...10 hours ago
- Multiple parties complain over Green MP Julie Anne Genter's conductSpeaker Gerry Brownlee won't say which parties have taken issue with Julie Anne Genter's outburst. ...10 hours ago
- Aggressive? Homophobic? Stoic? Here’s what thousands of Australian men told us about modern mascul...Source: The Conversation (Au and NZ) – By Michael Flood, Professor of Sociology, Queensland University of Technology Shutterstock Most young adult men in Australia reject traditional ideas of masculinity that endorse aggression, stoicism and homophobia. Nonetheless, the ongoing influence of those ideas continues to harm men and the people ...10 hours ago
- Watch live as the PM makes pre-Budget education announcementFrom next year, the government expects all public schools to take a "proven structured literacy approach". ...10 hours ago
- NZQA Jobs To Go As Government Education Cuts Roll OnThe NZQA proposal released to staff today would involve a net loss of 35 roles. There are 66 roles being disestablished with 13 of those currently vacant, and 31 new roles proposed, said Fleur Fitzsimons Public Service Association Te Pūkenga Here Tikanga ...11 hours ago
- The star-studded New Zealand movie you need to see as soon as possible
 Alex Casey talks to Loren Taylor, the writer, director and star of new film The Moon is Upside Down, about assembling her dream ensemble cast, toilet paper pads and turning literal dreams into reality. There’s a moment in The Moon is Upside Down where frazzled anaesthetist Briar (Loren Taylor) gets ...11 hours ago
 - Ministry of Housing and Urban Development to cut 40 jobs, NZQA to cut 35The total number of job losses in the public services has now gone over 3500. ...11 hours ago
- You’ve been ‘volun-told’ to coach junior sport – here’s how to best handle the parents inv...Source: The Conversation (Au and NZ) – By Cassy Dittman, Senior Lecturer/Head of Course (Undergraduate Psychology), Research Fellow, Manna Institute, CQUniversity Australia With winter sports swinging into action, adults around the country have volunteered or been volunteered by others (humorously known as being “volun-told”) to coach junior sports teams. ...11 hours ago
- Do we really need to burp babies? Here’s what the research saysSource: The Conversation (Au and NZ) – By Karleen Gribble, Adjunct Associate Professor, School of Nursing and Midwifery, Western Sydney University richardernestyap/Shutterstock Parents are often advised to burp their babies after feeding them. Some people think burping after feeding is important to reduce or prevent discomfort crying, or to ...12 hours ago
- ASB Workers To Strike As Bank Proposes An Effective Pay CutWorkers at a major ASB contact centre in Auckland have voted to take strike action and withdraw their labour following disappointing pay negotiations with the employer and an "offer" to workers that would leave them worse off than the previous year. ...13 hours ago
- Where else should phones be banned? The most unruly classroom of all – parliamentAs the government tries to get the country back on track with a school phone ban, Tara Ward has an idea for where they should turn their attention to next. New Zealand students returned to school on Monday morning, but their cellphones did not. The government’s new phone ban began ...13 hours ago
- Winston Peters accused of 'entirely defamatory' remarks about ex-Australian ministerThe Labour Party is demanding Peters be stood down, saying "he's embarrassed the country" with a "totally unacceptable" attack on a prominent AUKUS critic. ...13 hours ago
- Watch: Labour leader Chris Hipkins speaks to mediaThe opposition leader speaks to media during a visit with community advocate Dave Letele . ...13 hours ago
- Watch live: Labour leader Chris Hipkins speaks to mediaThe opposition leader speaks to media during a visit with community advocate Dave Letele . ...14 hours ago
- Public sector job cuts: All Stats NZ staff offered voluntary redundanciesThe PSA is concerned the cuts will hit the department's ability to deliver on its core functions. ...14 hours ago
- IPAC wants to see acknowledgement of all cyber breaches against public figuresThe Inter-Parliamentary Alliance, whose members were victims of a China-backed cyber attack, is discussing forming a standing committee to deal with foreign influence. ...14 hours ago
- Government’s Cuts Put Work Of Stats NZ At RiskThe PSA is concerned that the voluntary redundancies being offered to staff by Stats NZ will impact on the agency’s ability to deliver on its core functions. ...14 hours ago
- Is cooking with dog food instead of meat actually fine? I gave it a goResults ranged from surprisingly yum to soul-destroying. I love cooking. The kitchen is a hearth of culinary creation, of sensory delights, of gastronomic poetry. I also can’t afford anything nice. Why does a pack of instant noodles and some milk cost ten bucks? I love you, Aotearoa, but I miss ...14 hours ago
- Zero tolerance – Solomon Islands police on high alert ahead of PM electionBy Koroi Hawkins, RNZ Pacific editor Police in Solomon Islands are on high alert ahead of the election of the prime minister today. The two candidates for the top job are former foreign affairs minister Jeremiah Manele at the head of the Coalition for National Unity and Transformation, which is ...15 hours ago
- Fast-track Submitters Must Not Be Silenced Through Poor Select Committee Process“We’re concerned that if the Select Committee process is poorly run members of the public will be silenced on this deeply troubling Bill.” ...15 hours ago
- Number of businesses seeking help to downsize doubles as unemployment growsAn advocate says businesses are hurting and are reluctantly having to lay off workers. ...15 hours ago
- Help Me Hera: My friend’s boyfriend Steve is always, always, always aroundHe’s fine but it feels like I’m losing a friend and it’s making me bitter. How do I say ‘enough is enough’? Want Hera’s help? Email your problem to helpme@thespinoff.co.nz Hey Hera, I’ve recently moved in with a girlfriend, her partner Steve, and his friend. We all live in a lovely little house. ...16 hours ago
- What junior doctors’ unpaid overtime tells us about the toxic side of medicineSource: The Conversation (Au and NZ) – By Claire Hooker, Senior Lecturer and Coordinator, Health and Medical Humanities, University of Sydney PeopleImages.com – Yuri A/Shutterstock What’s been described as the largest underpayment class action in Australian legal history has just been settled. Who was allegedly underpaid? Thousands of junior ...17 hours ago
- We think we control our health – but corporations selling forever chemicals, fossil fuels and ult...Source: The Conversation (Au and NZ) – By Nick Chartres, Senior Research Fellow, Faculty of Medicine & Health, University of Sydney shutterstock Ahmet Misirligul/Shutterstock You go to the gym, eat healthy and walk as much as possible. You wash your hands and get vaccinated. You control your health. This is ...17 hours ago
- Here’s how you can talk to your kids about gendered violence, and 7 ways to model good behaviourSource: The Conversation (Au and NZ) – By Jacqueline Hendriks, Research Fellow and Lecturer, Curtin University Children and young people may be seeing news headlines about men murdering women or footage of people rallying to call for action. Perhaps they or their friends have even gone to the protests. ...17 hours ago
- Why are adults without kids hooked on Bluey? And should we still be calling it a ‘kids’ show’?Source: The Conversation (Au and NZ) – By Jessica Balanzategui, Senior Lecturer in Media, RMIT University ABC “Bluey mania” shows no sign of abating. Bluey’s season finale, The Sign, was the most viewed ABC program of all time on iView. A “hidden” follow-up episode, aptly named The Surprise, created ...17 hours ago
- Over $300K spent on slushy syrup and maintaining machines for prison staffCorrections has spent over $305,000 on slushy syrup and maintaining frozen ice machines in the past six years. ...17 hours ago
- Winston Peters still trying to find out what Aukus Pillar 2 is aboutThe Foreign Minister says he is continuing work started by the previous Labour government. ...17 hours ago
- Unemployment up, business confidence downLabour market figures came in softer than the Reserve Bank had forecast, but they won’t be enough to move the needle on interest rates, writes Catherine McGregor in this excerpt from The Bulletin, The Spinoff’s morning news round-up. To receive The Bulletin in full each weekday, sign up here. Unemployment ...17 hours ago
- Luxon’s leadership test: what would it take to win back unimpressed NZ voters?Source: The Conversation (Au and NZ) – By Suze Wilson, Senior Lecturer, School of Management, Massey University Christopher Luxon’s sacking of two struggling cabinet ministers last week was praised by pundits as a sign of decisive – even “brutal” and “ruthless” – leadership. But this week’s 1News-Verian poll suggests the ...18 hours ago
- Government to tweak Building Act to make building a home easierBuilding and Construction Minister Chris Penk says it takes nearly 600 days to build a house in NZ - and that is simply too long. ...18 hours ago
- Citizenship (Western Samoa) Act 1982 Bill Steering Committee Launches Community Engagement CampaignThe campaign will engage the community and encourage submissions on the bill to the New Zealand government by the closing submission deadline of Friday 31st of May 2024 4pm. ...19 hours ago
- Shaky Foundations: Why Our Democracy Needs Trust | Limit Urgency To Rebuild Trust: New ResearchThe paper raises concerns about declining trust in New Zealand's political institutions and democratic processes, and the role that the overuse of Parliamentary urgency plays in that. ...19 hours ago
- My co-housing project failed, but I still think it’s a great ideaThe Urban Habitat Collective was an attempt to built an innovative new form of apartment building in Wellington. Here’s why it failed, and why the idea could still work, writes co-founder Bronwen Newton. When we started the Urban Habitat Collective in November 2018, we thought we were starting a revolution, ...20 hours ago
- A new generation of activism: Marking 20 years since the foreshore and seabed hīkoiTwo decades ago this week, a controversial law that attempted to define ownership of the foreshore and seabed prompted a formidable display of outrage and kōtahitanga as 15,000 marched to parliament. Jamie Tahana looks back. ‘Hīkoi, hīkoi,” they chanted by the thousands as the biggest Māori march in a generation ...20 hours ago
- New push for corporate killing laws
 A Labour Party Member’s Bill aims to plug a culpability gap between manslaughter and health and safety breaches The post New push for corporate killing laws appeared first on Newsroom. ...20 hours ago
 - Book of the Week: The naked civil servantTerence O’Brien had the rare and no doubt undesired distinction of rising to one of the most exalted positions in New Zealand diplomacy, then being unceremoniously recalled to Wellington without explanation just when his career was at its zenith. What is perhaps more surprising is that he appears to have ...20 hours ago
- Concerning proliferation of working groups, jobs for matesGovernments are increasingly opting for working groups – led by their mates – over the core public service The post Concerning proliferation of working groups, jobs for mates appeared first on Newsroom. ...20 hours ago
- Concerns of spending spree if disability funding changes were consulted onWhaikaha had no intention of giving anyone – even other agencies – advance warning of its plan to limit what disabled people and their carers could buy The post Concerns of spending spree if disability funding changes were consulted on appeared first on Newsroom. ...20 hours ago
- Newsroom daily quiz, Thursday 2 MayLoading…(function(i,s,o,g,r,a,m){var ql=document.querySelectorAll('A,DIV,A[data-quiz],DIV[data-quiz]'); if(ql){if(ql.length){for(var k=0;k<ql.length;k++){ql[k].id='quiz-embed-'+k;ql[k].href="javascript:var i=document.getElementById('quiz-embed-"+k+"');try{qz.startQuiz(i)}catch(e){i.start=1;i.style.cursor='wait';i.style.opacity='0.5'};void(0);"}}};i['QP']=r;i[r]=i[r]||function(){(i[r].q=i[r].q||[]).push(arguments)},i[r].l=1*new Date();a=s.createElement(o),m=s.getElementsByTagName(o)[0];a.async=1;a.src=g;m.parentNode.insertBefore(a,m)})(window,document,'script','https://take.quiz-maker.com/3012/CDN/quiz-embed-v1.js','qp'); Got a good quiz question? Send Newsroom your questions. The post Newsroom daily quiz, Thursday 2 May appeared first on Newsroom. ...20 hours ago
- Daily crossword, Thursday 2 MayThe post Daily crossword, Thursday 2 May appeared first on Newsroom. ...20 hours ago
- Palestinian activist ‘perplexed’ by minister’s special visa argumentAs Palestinians escape the war zone in Gaza, activists say emergency visas, like those issued to Ukrainians, are needed The post Palestinian activist ‘perplexed’ by minister’s special visa argument appeared first on Newsroom. ...20 hours ago
- When dying well is out of reachWhy has New Zealand slipped from third to 12th on Quality of Death Indexes over the past decade or so? Hospice New Zealand Chief Executive Wayne Naylor has a list of reasons. “We don’t have a current national strategy – the Government hasn’t renewed our 2001 strategy, so we don’t ...20 hours ago
- New SASS Talk podcast sparks convo in sportWhile women’s sport is exploding in Aotearoa and around the world, you still don’t hear a lot of talk about athletes and their periods, RED-S, breastfeeding and visible panty-lines. SASS (Suze and Sez Sports) Talk isn’t afraid to have that kōrero. LockerRoom founder Suzanne McFadden and Olympian broadcaster Sarah ...20 hours ago
- Season two of The Boy in the WaterOn an unusually hot night in January 2019, a little boy’s lifeless body was found face up in a small town’s sewage oxidation pond. To the police, it was an open and shut case: three-year-old Lachlan Jones had run away from his home in the Southland town of Gore, climbed ...20 hours ago
- Green MP Julie Anne Genter apologises for 'intimidating' actions in ParliamentRongotai MP Julie Anne Genter has apologised in Parliament after National accused her of intimidating and attacking one of its ministers in the House. ...1 day ago
- Politics with Michelle Grattan: Anne Summers says we need much more information on male perpetrators...Source: The Conversation (Au and NZ) – By Michelle Grattan, Professorial Fellow, University of Canberra The Prime Minister and state and territory leaders met on Wednesday as the national cabinet to discuss a crisis gripping Australia – the horrific number of women murdered this year. The killings have shocked ...1 day ago
- Live cattle exports help farmers diversify income – Associate Agriculture MinisterThe government is hoping live animal exports will resume next year, but with a strict gold standard in place. ...1 day ago
- Who were the real courtesans at the heart of Netflix’s Heeramandi?Source: The Conversation (Au and NZ) – By Radhika Raghav, Teaching Fellow, School of Humanities and Social Sciences, University of Otago Netflix Indian director Sanjay Leela Bhansali is known for his big-budget Bollywood production, featuring grand sets, star casts, meticulously choreographed dance sequences and lavish costumes, jewellery and furnishings. ...1 day ago
- Police Minister Mark Mitchell heads to Australia to discuss crime trends, youth offendersMark Mitchell will be chewing the fat with police chiefs as officers in this country talk openly about the appeal of crossing the Tasman. ...1 day ago
- Te Kāhui Tika Tangata Human Rights Commission Pays Tribute To Sir Robert Martin MNZMSir Robert devoted his life to disability rights after living in institutions in his younger years, says Kaihautū Tika Hauātanga | Disability Rights Commissioner Prudence Walker. ...1 day ago
- Passing Of Sir Robert Martin KNZMPeople First New Zealand Ngā Tāngata Tuatahi is deeply saddened by the passing of Life Member Sir Robert Martin KNZM. ...1 day ago
- James Shaw's valedictory – and his new roleShaw has bowed out of Parliament, and has already revealed details of what he is doing next. ...1 day ago
- James Shaw's valedictory – and his new rolesShaw has bowed out of Parliament, and has already revealed details of what he is doing next. ...1 day ago
- AUKUS: Winston Peters says NZ 'long way' from deciding on Pillar 2Peters spoke about the military pact in an annual 'scene setter' speech at Parliament on Wednesday evening. ...1 day ago
- National Cabinet has committed to a range of strategies to stop violence against women, but has it d...Source: The Conversation (Au and NZ) – By Anastasia Powell, Professor, Family and Sexual Violence, RMIT University Violence against women is not a women’s problem to solve, it is a whole of society problem to solve; and men in particular have to take responsibility. Those were the ...1 day ago
- Is bioenergy ever truly green? It depends on 5 key questionsSource: The Conversation (Au and NZ) – By Jessica Allen, Senior Lecturer in Chemical and Renewable Energy Engineering, University of Newcastle Snapshot freddy/Shutterstock Plans to revive an old coal-fired power station using bioenergy are being considered in the Hunter region of New South Wales. Similar plans for the station ...1 day ago
- Free school lunches scheme to get temporary funding until review is completeFunding for the scheme is set to continue for the "immediate few years" while officials work out what the alternative programme will look like. ...1 day ago
- Taxpayers’ Union Slams Secret List Of Judges’ PerksResponding to the long-awaited release of judges’ special allowances, including free air travel and hotels for spouses, generous sabbaticals, and access to limousines, Taxpayers’ Union spokesman Alex Murphy said: “In what world does your employer ...1 day ago
Ka pai. nice story. Those kind of stats put a lot of pressure on Thursday’s budget to be about something more than vote buying I reckon.
Eight years of a Labour government and “See that line that says minimum wage? Nearly half of kiwis earn less than that.”. That tends to indicate that income transfer is not working as it hasn’t improved overall productivity and therefore income.
“I get to sit in meetings for hours just letting the conversation wash over me like fresh air”, I would love to know which employer can afford to let you do this. The public service perhaps ?
I hear that brother. In the 90’s I worked for $8 and hour as a temp gutting fish on the nightshift, grinding lead paint off a brick wall, as a cleaner as a factory hand and moving furniture amongst a whole lot of other shitty jobs. Each time I didn’t know if I had a job the next day or not and each time I was surrounded by people in the same position. I was lucky I didn’t have a family to feed. Others were not. Let me tell you, when you get a whole lot of people who are working their rings out only to fall further and further into poverty and who don’t know where their next paycheck coming from it’s not pretty.
In one factory I worked in every single worker was a temp. If anyone spoke up about the shit conditions (exposed scorchingly hot surfaces, dangerous chemicals, etc) they were told not to come back. Unemployment was huge and benefits were so low you would virtually work for food. On that particular job workers would regularly end up beating the shit out of each other over trivial things. It was like being in a room with fifty beaten dogs for 12 hours a day. I came off that job with burns all the way up one arm from one of the kilns and a lucky escape from an assault charge. One of my coworkers killed himself.
Now I’m in the top tax-bracket. I’m no more qualified than I was then – the job market and our society is just that much better. I do not begrudge one cent of the tax I pay.
Cheers, Dan and stevedore.
Easy to see the fella that’s always had it sweet eh? So shocked that half of people are on $27K and less, and blames Labour, the Government that’s done more for wages than any government in 30 years.
I tell you what Byran, my workmates didn’t blame Labour, they blamed the cheap-arse bosses, they knew it was thanks to Labour their wages had gone up at all.
.. I had a few paragraphs for this kind of silly bugger who doesn’t get it but the post was already so long, so here they are now:
“People are often surprised when they see what the distribution of income actually looks like. Those commentators who have been talking of the middle-class earning the range of $60,000 might be especially interested to see that the real middle class (usually defined as having an income within 30-40% either side of the median) earns between $27,000 and $53,000.
These are people who have benefited from minimum wage rises, a full-employment policy, Working for Families, and a host of other initiatives. Incomes are up 15% above inflaiton in just eight years under Laobur, that’s after they stagnated and fell for most people in the 1990s. It is shocking for many to realise how low most people’s incomes are (bearing in mind these figures include retirees, beneficiaries, part timers, and those not in the workforce), but is more shocking how low they were before we had a government that worked for them.”
Although to be fair, that original graph is distorted by the 439,683 recipients of NZ super in the 10-20,000 column
If you are making a point about wages and employment(your post is entitled workers rights), would it not be best to use a table from the census that only includes those in full or part time work, (it is table 12 in the income quickstats publication)
No, because I’m talking about the distribution of income across society, not just one section of it.
If you only look at the 2.2 million people who are employed you forget the one million who aren’t. they don’t just disappear, they have to buy food, clothing, housing etc too, they have an income to live too… and it’s just as much a policy choice (even more so) what level of income those people have to live on – super levels directly affect nearly 500,000 people, working age benefits another 240,000.
A change to the minimum wage affects 300,000, plus mayn more on near-minimum wages who get bumped up too.
My personal story relates the fact that a great number of people on those low incomes are working, working damn hard.
And look at the median employed income, it’s still $38K, not exactly the 50-70K that many seem to think is middle class now.
“..they knew it was thanks to Labour their wages had gone up at all.”
Are you talking about the same people who are about to throw labour out of power? How inconsiderate and ungrateful!
Advancement in wages have hardly kept up with consumer index price and cost of living. Taking into account the past years of economic bonanza (booming commodity prices, trade liberalisation, tariff reductions, etc.), you have to conclude that this Labour government has not delivered.
[Man, so much wrong in so few words: Labour has more support than National among people on low incomes, read the Fairfax poll. People on low incomes have seen their incomes increase sharply under Labour thanks to the minimum wage, record low unemployment, Working for Families, and a greatly increased social wage (eg doctor visit subsidies, 20Free). Wages are up 15% above inflation on average. search wages in our archives. Start with this graph. SP]
erikter – I think you’d rightly conclude that they’ve delivered, but there’s still more to do. “About to throw…”? So you’re picking an election when?
Wages have increased beyond inflation fool. In fact they’ve increased so much the National Party seems to think people need some of their work rights removed just to slow things down a bit. Check your facts before you make a comment muppet.
“See that $60,000 bracket? Less than 14% of kiwis have incomes higher than that.”
But Mickey C said only 5% of workers would ever be taxed in that bracket?
Gee it sounds like you have a cushy number with the Union SP. I bet my employee’s paying $5 or $6 bucks a week to you are pleased.
[no you’re wrong there son. Union officials work real hard and I’m not one of them.SP]
Steve: you haven’t really answered either of my questions. Looking at the recent political polls your “ex-workmates” appear to be blaming Labour now 🙂
I wonder also how your Labour friendly “ex-workmates” would feel if they knew how much faster incomes are rising in the unproductive public service than in the productive private sector: chart labour cost public sector premium
[I take your use of ” ” to mean you’re implying I’m not telling the truth. Do it again and you won’t be welcome here, in any of your pseudonyms. And if you had looked at recent polls, or, gee, just actually knew anyone on a lower income, you would know they haven’t turned their backs on Labour. SP]
[lprent: how about learning to link properly – fixed the link so it doesn’t spread all over the screen]
“…only 5% of workers would ever be taxed in that bracket?”
Cite? I only ask ’cause it sounds like a lie.
The way I remember it he was saying that the top rate would only effect the top 5 percent when passed.
We’ve never had inflation adjustments to the brackets, IIRC, so while it is an interesting and legitimate point, the idea that it is a uniquely cullenesque failing is dishonest.
I’m glad you got a mask Steve. I didn’t when my crew spent a day clearing sacks of white asbestos out of an old building scheduled for demolition. The health risks of asbestos were well known, but the foreman just told us to shut up and get on with it. Disposable workers. I’m still angry about it.
Then you also include people like me when I was a student in a flatting situation. I had several part time and holiday jobs; some of them quite crappy (spraying gorse comes to mind, although it paid better than the bar jobs). I also had a job that left me with a cough that lingered for years.
I certainly wasn’t wealthy – but I feel I had more freedom than, say, a family of 5 with a single $60k earner and a mortgage… I was probably happier and under less financial stress than them.
Knowing that many different types of earners are bundled into the graph above reduces its impact I think. Perhaps household income would be a better choice?
Hey Bryan – I like having a functioning public sector, more police and more nurses. Why don’t you just fu*k off to Somalia if you want small government? I’ll happily put the hat around for your one-way ticket.
[now, now, let’s be civil. Bryan might think that doctors and police and roading engineers are ‘unproductive’ but that’s not a reason to play the fool too. SP]
Steve: I wasn’t implying you were lying & I have done my share of poorly paid, menial jobs including packing caustic soda & pool chlorine for $8.00/hr.
I don’t think that “doctors and police and roading engineers are ‘unproductive’ “, I do think that a lot of the 43,000 employed to generate red tape and write reports and attend meetings in the core public service would be doing this country a favor if they joined the migration flood to Australia.
migration surge to australia accelerates
[lprent: and again. It isn’t hard to put in a correct anchor, damnit]
Linkwhore.
[lprent: you’re more boorish than usual today. If fact you’re getting quite tiresome – personal problems?]
[lprent: ok – i apologize after fixing some long links. Those things look as messy as hell in firefox]
hooton wont get a bonus for not engineering a snap election before the due date…he keeps saying if JOhn Keys were in now…what does he mean by that?
” Start with this graph. SP”
Is that the one where you cocked up the Maths?
Yeah, I think it is…
[Tane: The figures in that graph originated from Treasury and have not been refuted. I’m happy to provide you with data as I did for David Farrar.]
When you talk about the public sector you are mostly talking about doctors and teachers and police. There are 250,000+ employees in the public sector. Only 36,000 of them are in the core public sector (which includes Courts, prison guards, customs officials, social workers etc) and, yes, people whose job it is to develop policy and legislation. Because policy and legislation don’t magically happen but we do need them, we need to work out how best to allocate our limited public revenues for the public good, we need to update and revise our laws as the world changes.
Come join the real world and stop making silly claims like the public service doesn’t do anything.
(and the migration figures are perfectly consistent with the more cycle – numbers, and especially numbers per capita have been higher at the other two peaks in the cycle over the last 20 years)
The $11,000 difference between median income and median employed income is an indictment of the social welfare policies pushed for both Labour and National governments.
Besides the people in real need, the elderly and the disabled, New Zealand has too many bludgers living off the back of the productive sector of the population.
Reform the welfare system and you see the overall income numbers going up. There is a price to pay though. No pain, no gain.
Which one of the main political parties will have the guts to do it? None.
Robinsod: Thanks for that suggestion, “Linkwhore” is a great pseudonym, I think I’ll get it put on a T-shirt though I prefer to comment under my real name:-)
[lprent: I wouldn’t mind if you knew how to put them in correctly. All you have to do is this:-
<a href=’http://my-bloody-long-link’>The text I want to display</a>
It isn’t hard]
Low income earners love Labour because they keep dishing out freebies. That’s all there is to it.
living off the back of the productive sector of the population.
I have a friend who does marketing for British American Tobacco. He’s top tax bracket and his job is to find ways around the legislation and continue to sell death. I have another friend who is staying at home to raise two beautiful clever kids who will one day contribute to society and gets working for families and another friend who works for DIA monitoring internet crime.
I get the feeling (and correct me if I’m wrong) you would say my first friend is productive and my others are not. Really makes me wonder what kind of a world you want to see.
Those people are essential to the running of the country. If you got rid of them less of the work thats needed to run the country would get done and our country would fall even further behind in the OECD rankings.
Oh, wait, isn’t that what National’s promising?
In my opinion, if you chose to have kids, that’s your problem. Don’t buy a house if you can’t afford to service it.
But what if you want to sell them for food?
[Tane: The figures in that graph originated from Treasury and have not been refuted. I’m happy to provide you with data as I did for David Farrar.]
That would be great if you could – better yet would be a link to the page you got them from
=)
Thanks
[Tane: I received them through the CTU, who were provided them by Mallard’s office along with a bunch of journalists. I’ll email you the data at the email address you’ve supplied.]
Eat them instead 🙂 Tastes like chicken… or so I hear…
DracoTB: “Those people are essential to the running of the country.” Yes but are they really?
The number of core public servants has increased by 16,000 since 2000 Bloody Long Link One and over the same period productivity growth has declined from 2% to 0% Bloody Long Link Two and tax burden has increased by 20 days Bloody Long Link Three . These core public service employees have been busily generating more compliance costs for those of us in the “real world”.
[lprent: better. I even finally wrote the section just for you. How to link. I really have to finish the code for the WYSIWG comment editor & intergrate it with the rest of the site]
There’s a glut on the market after the ‘quake and typhoon.
For that asset you’d be better to ‘accumulate/hold’ rather than ‘sell’ right now.
I wonder if Labour Party policies endorsing gambling and prostitution are helping the poorer sections of society? Or are they just broadening the tax base?
Robinsond, if your friend wants to raise a family and decides to stay home for that purpose that is HIS problem, not mine.
Do you expect society as a whole to have to pay for individuals’ decisions such this, regardless of the good intentions behind them?
Why should childless couples or other citizens paying taxes have to prop your friend up with money for his WFF?
It’s very easy to “sacrifice” yourself, as your friend is doing, knowing then Nanny State is behind you. Efficient is not.
[Tane: I won’t tolerate veiled threats against the livelihoods of posters. There will not be another warning.]
“Why should childless couples or other citizens paying taxes have to prop your friend up with money for his WFF?”
Because those non-childless couples children – the nation’s future – will be supporting the childless couples in their old age.
What goes around comes around.
Apologies Tane
It was never intended as a threat just a rye observation.
Fair enough then – I read it as a veiled threat but I’ll take your word for it.
Steve has taken a very big personal risk by outing himself considering some of the threats we have received from the Kiwiblog Right, so you’ll understand why I have a very low tolerance on this issue.
Tane
I hope by Kiwiblog right you don’t mean David Farrar I don’t think he’s particularly dangerous or likely to engage in fisticuffs.
In joker’s defence I read his comment as a joke and not threatening at all
a rye observation
Can I get fries with that?
Sorry – I don’t usually do picky spelling (wry), but that one was cute.
HS, no, not Farrar. The Kiwiblog Right refers to the culture in the comments section, and in particular some of the more rabid commenters.
Fair enough thought that’s what you meant – although David and SP doing fight for life would be funny as a fit
r0b
Sorry about the spelling.
I Haven’t had a chance to have lunch yet which can get your brain into a bit of a pickle (do you see what I did there)
Lots of banter, but nobody has a particularly convincing argument why the graph above is not deliberately misleading.
Steve has tried to answer:
I once worked after school in the local fish and chip joint. That would have put me on your graph. However at the time I did not have to buy food, clothing, housing etc.
Many of those that aren’t employed are dependent on others that are. You’ve rolled in together kids with paper runs or mowing jobs, retirees, students, part-time mums and dads, etc. Then you have left the only suggestion being that all low income earners have crummy dangerous jobs.
That’s misleading at best.
[it’s not misleading because it’s about the incomes of all New Zealanders. Incidentally, your Fish n Chip job would put you on this graph and the one that you want that only counts employed people. SP]
You will find the same type of administrative positions in large corporations and they do the same things. Write reports, make rules, add red tape that annoys the hell out of those people who actually have to implement it. Do you think these corporations would be paying out large sums to people if they didn’t think it necessary?
ha, the productivity chart shows a percentage change from year to year. It doesn’t show that productivity has decreased to zero. It shows that there was no change (0%) in the last period, an increase in the period before etc. It also shows that productivity increases over the long term is stable and hovers around 0% change. Exactly what you would expect.
PS. Do you think you could link the actual data that the blogger used?
If that’s the case then why not use the graph that shows employed people? The post is in the “worker’s rights” category and is framed with examples of terrible employment cases. All of the workers cases mentioned here would be on the employed graph.
Why, at a time when unemployment is historically low, would you include non-workers on a graph about wages?
Is this about workers (eg the cases you use to illustrate your point), or about the rate of national super and the DPB?
I’m all for intelligent argument, but the dots don’t join up between your graph and initial post.
jbc good point.
It would seem all 15+ year olds are on that graph.
Someone working part-time is obviously not going to make full-time annual wage.
‘Nearly half of kiwis earn less than minimum wage’ to me this comment does not really explain much. Is this a bad thing, a good thing, on par with other countries?
If this includes part time workers, 15 year olds doing paper runs, unemployed, whatever… I don’t find the graph useful… or am i missing something?
a bit of a pickle (do you see what I did there)
tee hee!
alex, finally some intelligent life!
You make a good point too. I can’t see what benefit there is comparing the after-school income of my 15 year old self, with my income now as a full-time professional with nearly 20 years of experience.
At 15 I probably thought 5 dollars an hour for slicing potatoes was pretty good. They gave me some free 20c pieces for the games machines! And I didn’t have a mortgage or any dependents either.
captcha: “Prentice rescued”.
just looking at incomes of employed people would ignore the fact that there are people without jobs who want to work and their incomes are lower because they can’t find work. It would also ignore the income levels of the nearly three quarters of a million people who get super, DPB, sickness, invalids, or unemployment (those benefits in order of number of popel who get them).
It’s not such a big deal when you’re looking at one snapshot in time and a very low unemployment period when benefit levels are stable but we’ve done a whole bunch of graphs on incomes and we always use medians and all incomes because otherwise you miss out major effects like changes in employment levels and benefit levels and how those impact on real people.
You can slice and dice the figures anyway to make them look how you want – like when Farrar tried to pretend incomes went up faster under National but looking solely at the average ordinary time full-time wage – that’s why it’s best to stick with the full picture when the question at hand is ‘what is the distribution of income among kiwis?’
we don’t have an infinite number of catagories (we do of tags) so I chose the catagory most aligned with the topic.
jbc. Comments like yours make me despair. 300,000 people earn on or about the minimum wage and many of them do have dependents to look after.
I tried to give you a look into what life is like for the bulk of the population who have incomes around that level and all you can do is talk about when you were a kid peeling potatoes.
Try to imagine, working for minimum wage in a soulless job for a greedy boss who regards you as disposable. Imagine trying to get by and raise your kids on $25,000 a year. And then, imagine that just 8 years ago, under National you were getting just $14,500 a year, and you know that if they come into power again, there will be no more pay-rises for you, even as inflation eats away at what you do get.
I wonder if you can.
Well I’m sorry but I think that the figures presented don’t really tell much of a story. There are too many factors included for a savvy person to be able to distill anything useful. Also, if you lump in all the different types of individual income then you can not really talk about supporting dependents – as they might be in the graph too. That’s where household income would be applicable.
I understand your dilemma of trying to show a broad picture without using too many (complicated) facts and figures – but this could have been done better.
Incidentally, since you mentioned the numbers came from Treasury I looked over there for the numbers. Didn’t find (no worry), but what I did notice was this:
Average family gross income: ($)
– couple with children 92,882
Wow! If that’s true then it is bloody fantastic. I guess WFF has boosted that number.
Steve,
“I tried to give you a look into what life is like for the bulk of the population who have incomes around that level and all you can do is talk about when you were a kid peeling potatoes. ”
“tried” being the operative word, I now see where you’re coming from but this was not obvious from the original post or the graph used to back it up.
Your lumping everything into one graph, it really makes the graph meaningless.
“See that line that says minimum wage? Nearly half of kiwis earn less than that.” … again is this bad? is this good? is this on par with other countries? This statement it not useful if you lump everyone on a graph.
If a solo mum with 3 kids is earning less than minimum wage then that’s bad.
If a stay-at-home-mum who is supported by her husband earning $150k is earning less than minimum wage, big deal.
I’m not disagreeing with the spirit of your post, just the graph that doesn’t follow.
I mean no disrespect to those on low incomes with families, however if you wanted to show the picture of family despair then more carefully chosen facts might do a better job. Quite obviously family incomes are significantly higher than individual incomes.
I don’t need a lecture on poverty though. I know exactly what it is.
Steve
Interesting graph, it shows very clearly just how powerful a zero rated tax threshold of circa $20K would be in delivering more money to the pockets of the most needy.
I think I can see why Dr. Cullen isn’t a fan of a zero rated threshold, that being that if he isn’t taxing low earners he’s not able to play fairy god mother with their own money to buy their support.
Imagine what a different debate this would be if all tax payers (not just targeted groups which were shown by internal polling to be non Labour voters) below the “minimum wage” threshold were not paying tax so that it could be redistributed to people earning more than them.
Steve
When I first started working I was earning $109/week and the dole at that time was $90/week. For my extra $19/week I had to pay $9/week on public transport, $1.50 on compulsory union fees and I had to have a completely different wardrobe than if I had been on the dole. If you were thinking I wouldn’t have a lot remaining to save for house then you would be correct.
At that time people were saying that welfare compared to trainee/apprentice incomes was too high, and/or wages were too low, and that such comfortable welfare provided little incentive to work.
Would you get out of bed at 6:00am catch a train, a bus and work 8 hours then catch a bus and a train 5 days a week for such a slim margin over the dole while incurring additional costs to do so?
So how much has really changed? Here on this blog you bang on about the need to lift wages, as I did then and as I do now. It was a Labour govt then, it’s a Labour govt now and still nothing changes.
Vote for a change, stop being suckered by this “we look after the workers” bullshit from Labour, the Labour pollies look after themselves and the workers get shafted – welcome to Labour govt.
Why don’t you, Tane and a few other anon bloggers here at the Standard start a new workers party, I’d vote for it if it puts it’s own beliefs into it’s policies and stopped being apologists for a bunch of self serving poll driven redistribution junkies.
Whatever Steve, we’ve all done shit jobs while at university. More fool you for taking on an asbestos job.
I’ve paid my own way, paid my own student loan back, paid my share of tax – what do I get out of Labour? Fuck all mate, a shit health sytem, no investment in infrastructure for a decade until it starts to fall down, schools being closed, train system being fuckedup, and now a bunch of freakin right on academic socialists telling me I should be thankful for getting screwed.
I don’t know where you live matey but 60k in Auckland with a mortgage and kids is minimum wage.
Think about the guys you were labouring with who had to support a family – they dont know that x% wage increas was actually 2/5ths of fuck all real increase given the cost of housing and basic living under labour.
“So, no, I don’t begrudge a government that wants to take a small part of my income to help out those who, because of the nature of our economic system, have it tougher than me and help look after their families.”
I disagree on the fact that 39% of my income is “a small part”. I have no children, private health insurance, few if any claims on the State. My direct taxes equate to at least two people on the minimum annual income. How much more do you want? Why is it my problem that people on low incomes feel they have a right to children and a house? I don’t even have a house.
How if I leave the country? Will that make you feel better?